ES-CON JAPAN Ltd. (TSE: 8892), a residential and commercial real-estate developer affiliated with the Chubu Electric Power group and the namesake of the "ES CON FIELD HOKKAIDO" ballpark, reported consolidated full-year results for the fiscal year ended March 31, 2026 (FY3/2026) under Japanese GAAP. Revenue rose 20.6% year-on-year to ¥137,029 million from ¥113,603 million, and operating profit climbed 22.5% to ¥26,101 million from ¥21,311 million. Net profit attributable to owners of the parent rose 8.9% to ¥12,191 million from ¥11,193 million, and basic EPS came in at ¥127.31 versus ¥117.18.
Strong operating gains, but ordinary profit held flat
The headline tension in this year's result was the gap between operating and ordinary profit. While operating profit jumped 22.5%, ordinary profit slipped marginally to ¥17,190 million (-0.8%) from ¥17,320 million. The drag came from an equity-method investment loss that widened sharply to ¥4,227 million — from just ¥426 million the prior year — together with higher financing costs as the developer carried a larger project pipeline. In effect, gains from the core development business were offset below the operating line, leaving ordinary profit roughly unchanged even as the top line and operating profit advanced by more than a fifth.
Leveraged balance sheet, expanding cash position
As a property developer, ES-CON carries a leveraged balance sheet typical of the sector. Total assets stood at ¥509,773 million and net assets at ¥86,122 million, for an equity ratio of 17.0% — broadly stable versus the prior year's 17.2%. Book value per share reached ¥904.53. On cash flow, operating activities generated ¥10,362 million, investing activities used ¥12,164 million, and financing activities provided ¥17,750 million as the company drew on borrowings to fund development, leaving period-end cash and equivalents at ¥62,053 million.
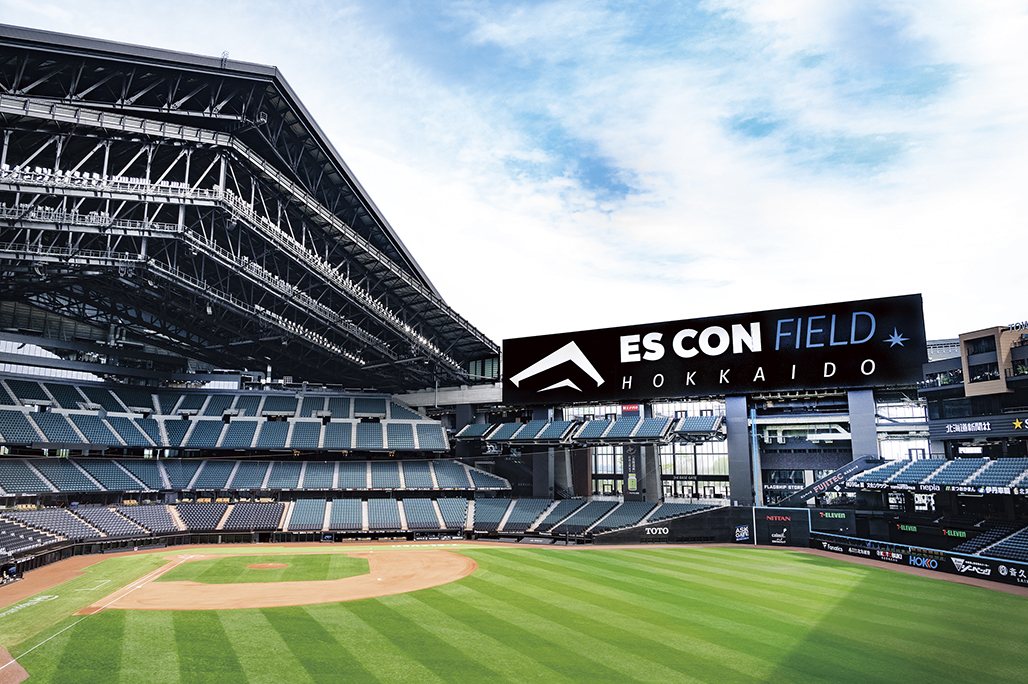
Consolidation scope widens; dividend held at ¥48
ES-CON expanded its consolidation scope during the year, newly adding Shiba Real Estate Co., Ltd. and Montedio Football Park Co., Ltd., the latter extending the group's footprint in sports- and stadium-related real estate alongside its ES CON FIELD HOKKAIDO development. On shareholder returns, the FY3/2026 annual dividend was held at ¥48.00 per share (year-end), unchanged from the prior year, for a payout ratio of 37.7%. Management guides a higher ¥53.00 annual dividend for FY3/2027, signalling confidence in a profit recovery.
FY27 guidance points to a double-digit profit rebound
For the fiscal year ending March 31, 2027 (FY3/2027), management's revised guidance calls for revenue of ¥145,000 million (+5.8%), operating profit of ¥26,500 million (+1.5%), ordinary profit of ¥20,000 million (+16.3%), and net profit attributable to owners of ¥14,000 million (+14.8%), with EPS of ¥151.42. The forecast implies that the equity-method drag should ease, allowing ordinary profit to resume growth and net profit to rebound about 15% after this year's flat ordinary line. With a 17% equity ratio typical of a leveraged developer and a steadily expanding project and consolidation base, ES-CON enters FY3/2027 targeting a return to bottom-line momentum.
| Metric | FY3/2026 | FY3/2025 | YoY |
|---|---|---|---|
| Revenue (¥M) | 137,029 | 113,603 | +20.6% |
| Operating profit (¥M) | 26,101 | 21,311 | +22.5% |
| Ordinary profit (¥M) | 17,190 | 17,320 | -0.8% |
| Net profit attrib. to owners (¥M) | 12,191 | 11,193 | +8.9% |
| Basic EPS (¥) | 127.31 | 117.18 | +8.6% |
| Equity ratio | 17.0% | 17.2% | -0.2pp |
| Annual dividend (¥) | 48.00 | 48.00 | 0.0% |
JapanStockPulse provides informational content only and does not constitute investment advice. Figures are taken from the company's published earnings short report and may be subject to subsequent revision.