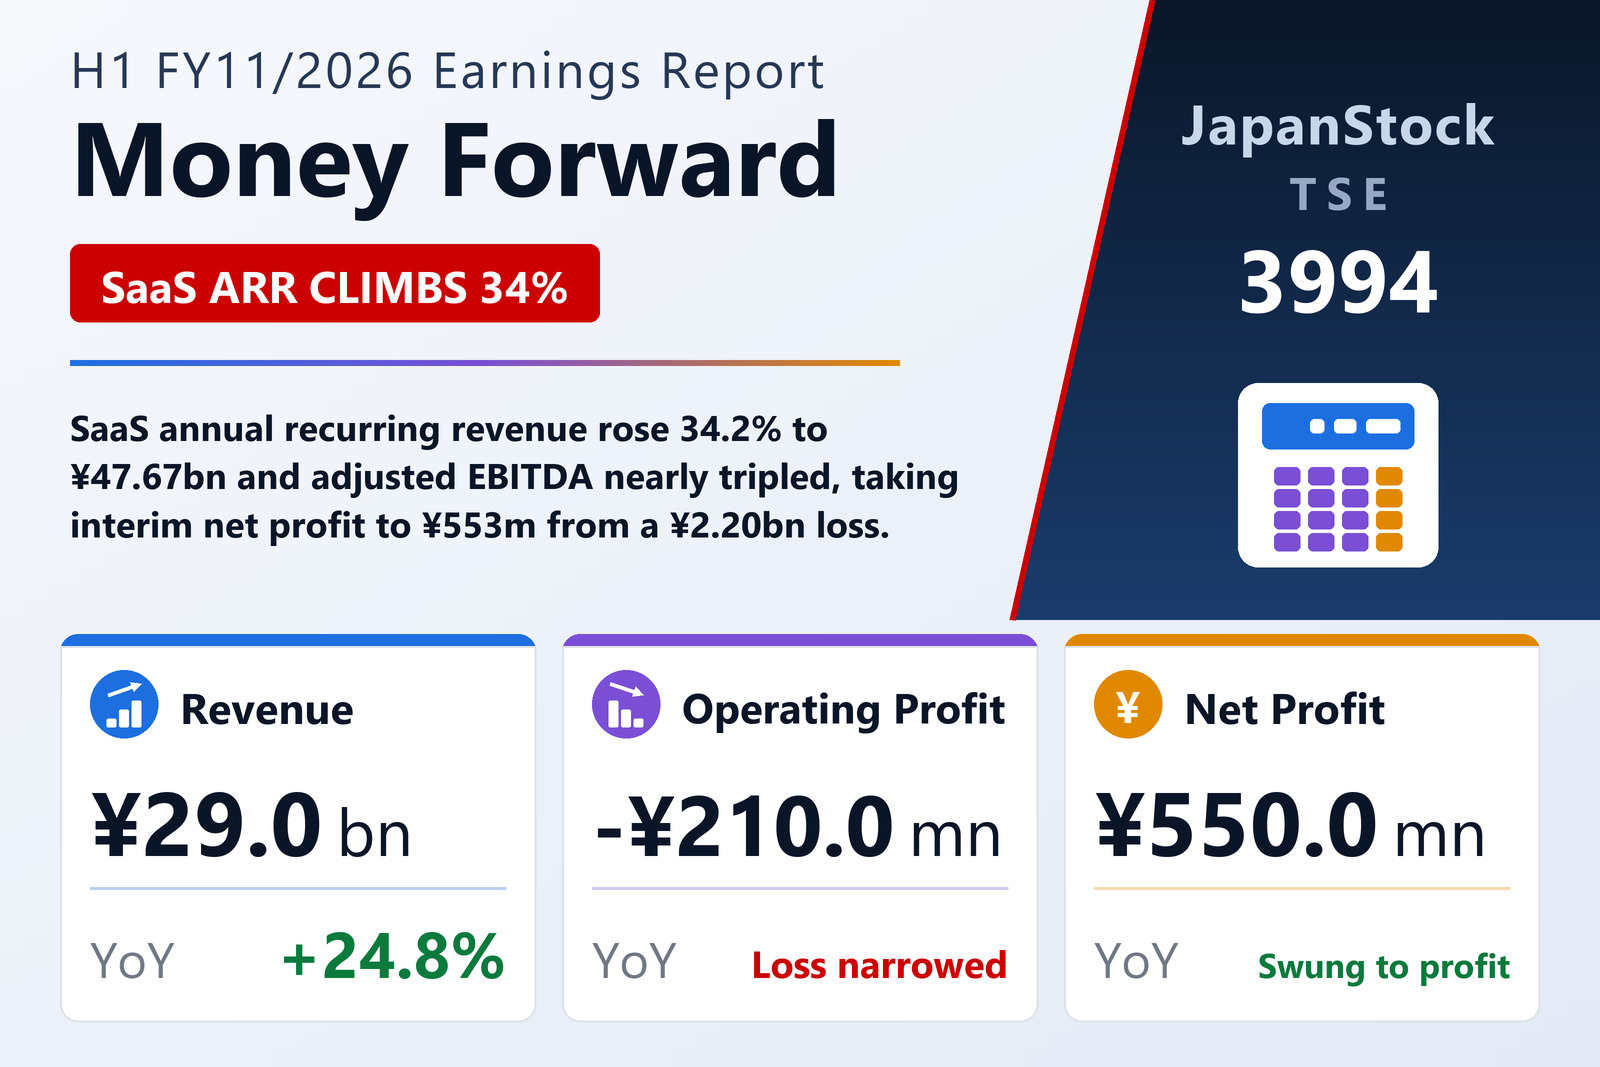
Money Forward, Inc. (TSE: 3994) reported consolidated first-half results for the six months ended May 31, 2026 under Japanese GAAP. Revenue rose 24.8% to ¥28,992 million and SaaS annual recurring revenue (ARR) rose 34.2% to ¥47,669 million. Adjusted EBITDA jumped 168.7% to ¥5,094 million, and interim net profit attributable to owners swung to a positive ¥553 million from a ¥2,197 million loss a year earlier. Interim EPS was ¥10.00 (prior -¥39.97).
Profitability inflection
The operating loss narrowed sharply to ¥209 million from ¥1,592 million and the ordinary loss to ¥1,205 million from ¥1,897 million, marking a clear turn toward profitability as recurring subscription revenue scales faster than costs. Excluding businesses divested during the prior year (Next Solution and Smart Camp), underlying revenue growth would have been about +33.1% to +37.1%.
Recurring-revenue engine
Growth is led by the Business segment — the "Money Forward Cloud" back-office suite for companies — alongside the Home personal-finance app, the X segment serving financial institutions, and a growing Fintech business (business card, early-payment and invoice-card-payment services). The group reshaped its portfolio during the half, adding four entities (including HIRAC FUND3 and Money Forward AI Back Office) and removing three.
Balance sheet
Total assets were ¥143,626 million and net assets ¥57,581 million, an equity ratio of 28.7%. The company pays no dividend, reinvesting cash into product development and growth.
Guidance raised
For full-year FY11/2026, management now guides — in a range — revenue of ¥60,500–62,300 million (+20.2% to +23.7%), SaaS ARR of ¥49,742–52,505 million, and adjusted EBITDA of ¥10,500–11,500 million (+111.6% to +131.7%). Operating profit is guided at -¥500 million to +¥1,500 million and net profit at -¥3,200 million to -¥700 million as investment continues.
| Metric | H1 FY11/26 | H1 FY11/25 | YoY |
|---|---|---|---|
| Revenue (¥ billion) | 28.99 | 23.24 | +24.8% |
| SaaS ARR (¥ billion) | 47.67 | 35.52 | +34.2% |
| Adjusted EBITDA (¥ billion) | 5.09 | 1.90 | +168.7% |
| Operating profit (¥ billion) | -0.21 | -1.59 | Loss narrowed |
| Interim net profit attrib. (¥ billion) | 0.55 | -2.20 | Swung to profit |
| Interim EPS (¥) | 10.00 | -39.97 | Turned positive |
| FY26 adj. EBITDA guidance (¥ billion) | 10.5–11.5 | — | +112% to +132% |
JapanStockPulse provides informational content only and does not constitute investment advice. Figures are taken from the company's published earnings short report and may be subject to subsequent revision.