Daiwa Co., Ltd. (TSE: 8247) reported consolidated first-quarter results for the fiscal year ending February 2027 under Japanese GAAP, covering March 1 to May 31, 2026. The company is the operator of the Daiwa department store chain in Kanazawa and Toyama on Japan's Hokuriku coast — a regional retailer with roughly ¥16 billion of annual revenue, and entirely unrelated to Daiwa Securities Group or Daiwa House Industry, with which it shares only a name.
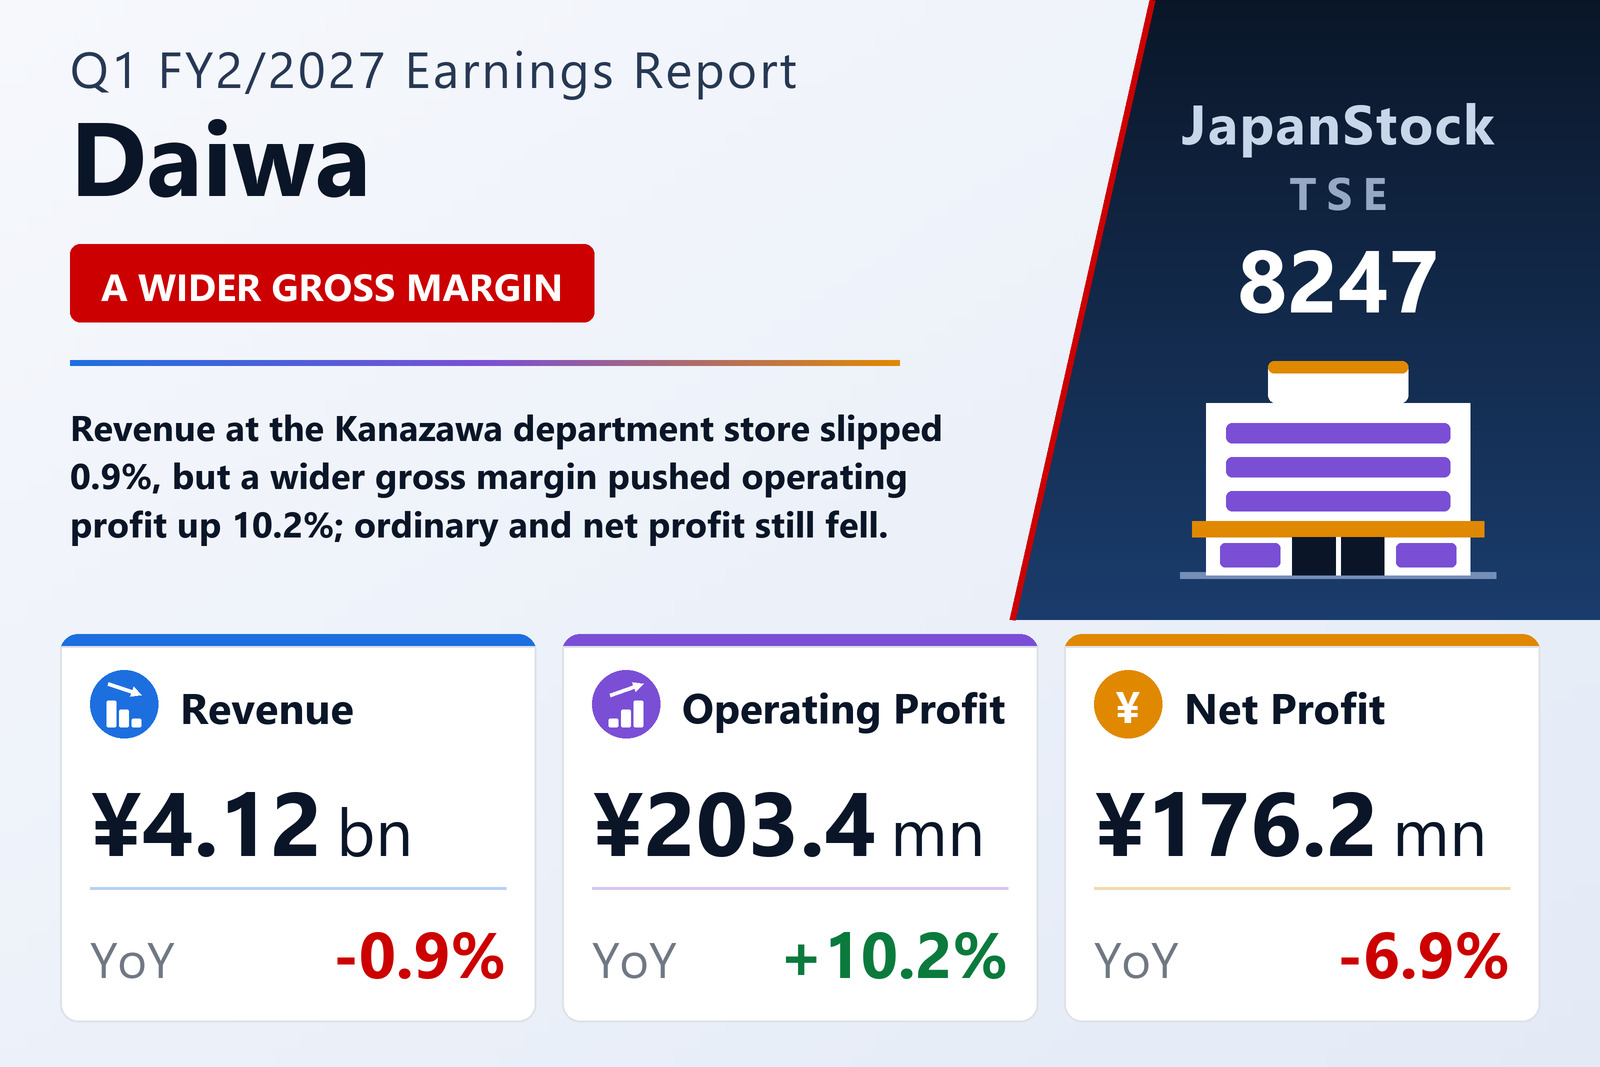
Revenue edged down 0.9% to ¥4,124 million. Cost of sales fell faster, by 3.9% to ¥1,914 million, so gross profit rose 1.9% to ¥2,210 million. With selling, general and administrative expenses up just 1.1% to ¥2,007 million, operating profit climbed 10.2% to ¥203 million. Below the operating line the picture reversed: non-operating income dropped to ¥132 million from ¥163 million a year earlier — chiefly a much smaller contribution from income recognised on long-unredeemed gift certificates — while non-operating expenses were roughly flat at ¥154 million. Ordinary profit therefore fell 7.0% to ¥181 million and, after a ¥20 million reversal of allowance for doubtful accounts and ¥25 million of income taxes, net profit attributable to owners fell 6.9% to ¥176 million. Basic EPS was ¥31.42, down from ¥33.76.
Two stores, five segments
Department stores remain the core: external segment sales of ¥3,475 million (-1.6%) accounted for 84% of the group total, though segment profit slid 20.1% to ¥115 million. The smaller units improved. Hotels turned over ¥310 million (+2.5%) for a ¥12 million profit (+24.1%); publishing generated ¥154 million (-3.4%) but quadrupled segment profit to ¥15 million; printing rose 9.0% to ¥76 million with profit up 15.9% to ¥30 million; and human resource services — promoted to a reportable segment in the prior fourth quarter as it grew in significance — nearly doubled to ¥20 million. On the pre-revenue-recognition-standard gross basis the company also discloses store-level sales: the Korinbo store in Kanazawa rose 1.7% to ¥5,773 million while the Toyama store slipped 0.9% to ¥3,975 million, for a combined ¥9,749 million, up 0.6%. Management credited limited-run concepts such as a Swatch pop-up — the brand's first in Hokuriku — and a renovated fresh-fish counter in Toyama.
Balance sheet deleveraging
Total assets fell 1.9% to ¥27,065 million against the February year-end, and liabilities dropped ¥637 million to ¥21,523 million as interest-bearing borrowings were pared to roughly ¥6.7 billion from ¥7.6 billion (long-term debt alone fell ¥484 million to ¥1,594 million). Net assets rose ¥106 million to ¥5,542 million, lifting the equity ratio to 20.5% from 19.7% and book value per share to ¥988.13 from ¥969.25. Comprehensive income was only ¥106 million, down 73.2%, because a ¥64 million mark-down on available-for-sale securities offset most of the quarter's earnings. Depreciation was ¥170 million against ¥179 million a year earlier; no cash flow statement is prepared for the first quarter.
Guidance held; dividend undecided
Daiwa left the forecasts it issued on April 10, 2026 unchanged, citing geopolitical risk, rising costs and increasingly thrift-minded consumers. For the full year to February 2027 it guides revenue of ¥16,000 million (+0.1%), operating profit of ¥250 million (+31.1%), ordinary profit of ¥150 million (-17.2%) and net profit of ¥100 million, with EPS of ¥17.83. First-half guidance is revenue of ¥8,000 million (+0.1%), operating profit of ¥150 million (-3.4%) and net profit of ¥50 million (-73.7%). Notably, the first quarter alone has already delivered ¥176 million of net profit against a ¥100 million full-year target — a reminder of how much the prior year's non-operating gift-certificate income flatters second-half comparisons. Daiwa paid no dividend for FY2/2026 and has again set the interim payout at ¥0.00; the year-end dividend for FY2/2027 is undetermined, and the company says it will announce a figure once a forecast becomes possible.
| Metric | Q1 FY2/2027 | Q1 FY2/2026 | YoY |
|---|---|---|---|
| Revenue (¥ million) | 4,124.39 | 4,161.87 | -0.9% |
| Gross profit (¥ million) | 2,210.25 | 2,169.83 | +1.9% |
| Operating profit (¥ million) | 203.36 | 184.48 | +10.2% |
| Ordinary profit (¥ million) | 180.93 | 194.65 | -7.0% |
| Net profit attrib. to owners (¥ million) | 176.20 | 189.35 | -6.9% |
| Comprehensive income (¥ million) | 105.72 | 395.23 | -73.2% |
| Basic EPS (¥) | 31.42 | 33.76 | -6.9% |
| Total assets (¥ million, period-end) | 27,065.21 | 27,596.18 | -1.9% |
| Equity ratio (%) | 20.5 | 19.7 | +0.8pt |
| Book value per share (¥) | 988.13 | 969.25 | +1.9% |
| FY2/2027 revenue guidance (¥ million) | 16,000.00 | — | +0.1% |
| FY2/2027 operating profit guidance (¥ million) | 250.00 | — | +31.1% |
JapanStockPulse provides informational content only and does not constitute investment advice. Figures are taken from the company's published earnings short report and may be subject to subsequent revision. Balance sheet and total-asset comparisons are against the February 28, 2026 fiscal year-end rather than the year-earlier quarter.