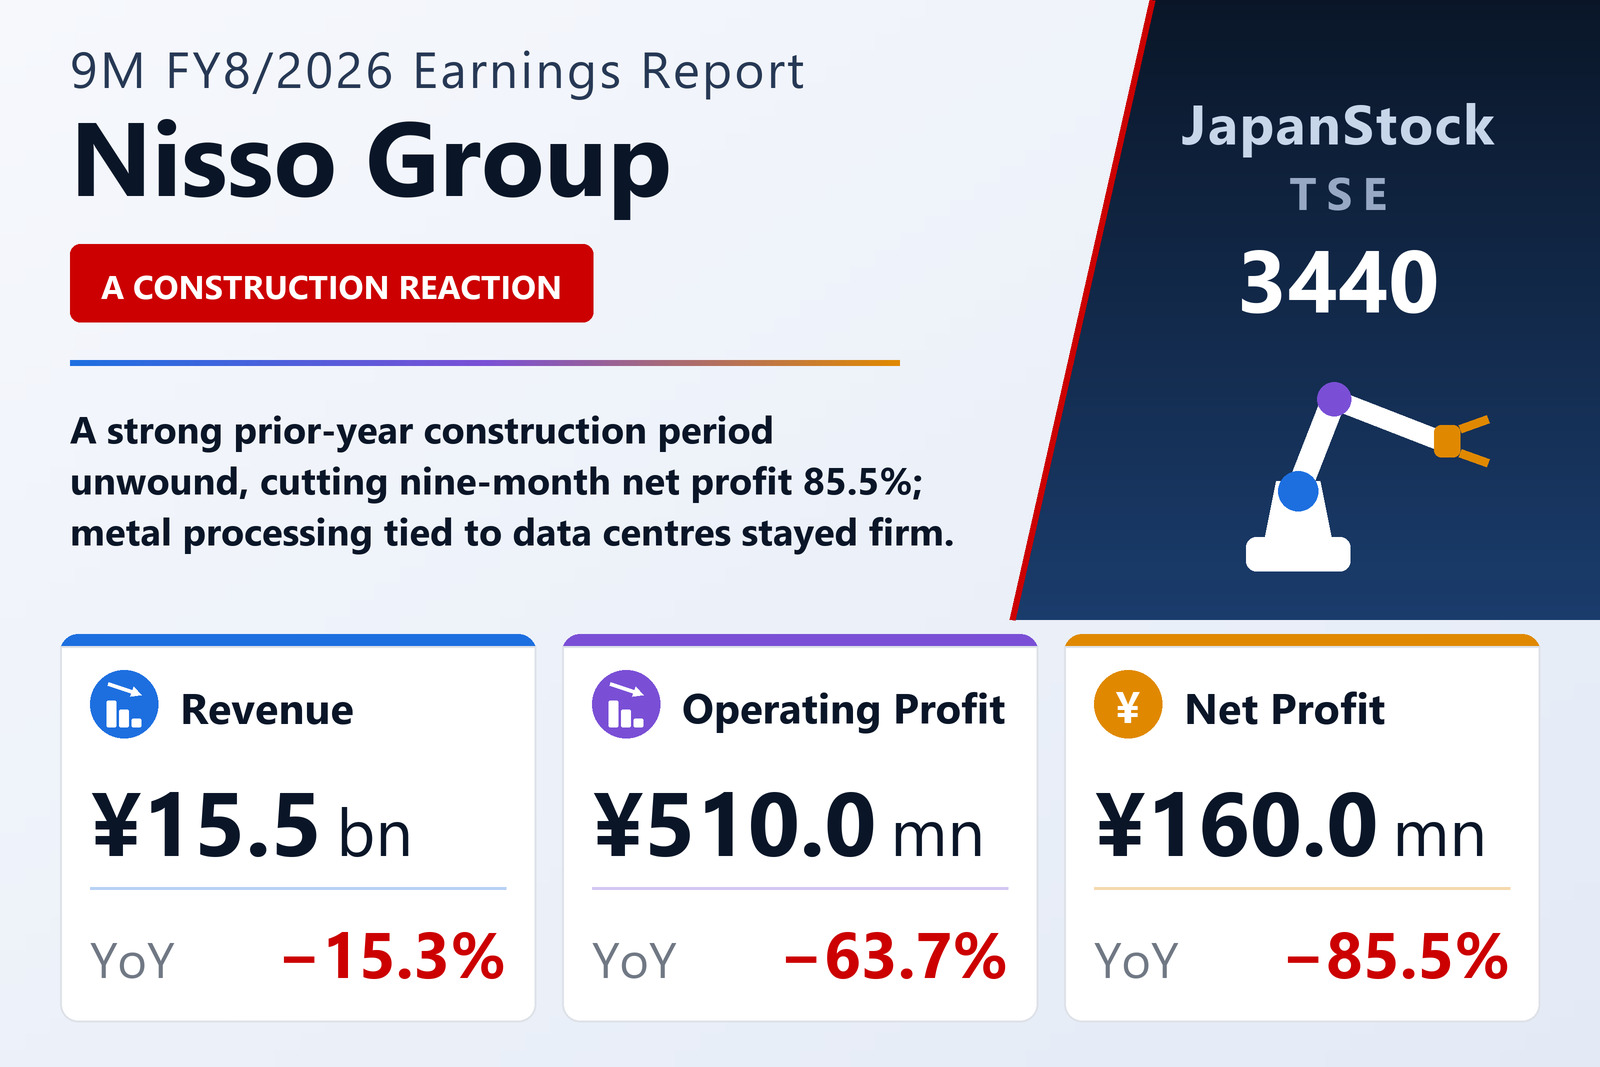
Nisso Group Inc. (TSE: 3440) reported consolidated results for the nine months to May 31, 2026 (the first three quarters of its fiscal year ending August 2026) under Japanese GAAP. Revenue fell 15.3% to ¥15,476 million, operating profit dropped 63.7% to ¥514 million, EBITDA declined 36.0% to ¥1,269 million, ordinary profit fell 62.7% to ¥530 million and net profit attributable to owners of the parent slid 85.5% to ¥158 million. Basic earnings per share were ¥24.63, down from ¥168.68 a year earlier.
Prior-year construction boom unwinds
Nisso Group is a Fukuoka-based diversified company spanning metal processing, chemical products, construction and renovation, and renewable energy. The decline was driven by its construction business, which faced a tough comparison after a prior year in which large projects were concentrated and progressed rapidly. Metal processing held up well on strong data-center-related orders, and chemical products benefited from subsidiaries consolidated in the prior year.
Expansion into property and renewables
During the period the group acquired B SLASH HOLDINGS — a condominium developer, seller and renovator — together with its subsidiaries, and it added 39 new consolidated subsidiaries, including renewable-energy vehicle Tohoku Clean Energy, as it builds out a clean-power portfolio under its fourth medium-term plan.
Full-year guidance cut
Management revised its full-year forecast for the year to August 2026 lower, now guiding revenue of ¥20,500 million (−11.0%), operating profit of ¥300 million (−78.3%), EBITDA of ¥1,339 million, ordinary profit of ¥268 million and net profit of ¥542 million (−40.9%), with EPS of ¥84.41. Total assets stood at ¥36,272 million and net assets at ¥12,603 million, for an equity ratio of 34.7%.
| Metric | 9M FY8/2026 | 9M FY8/2025 | YoY |
|---|---|---|---|
| Revenue (¥ billion) | 15.48 | 18.27 | −15.3% |
| Operating profit (¥ billion) | 0.51 | 1.42 | −63.7% |
| EBITDA (¥ billion) | 1.27 | 1.98 | −36.0% |
| Ordinary profit (¥ billion) | 0.53 | 1.42 | −62.7% |
| Net profit attrib. to owners (¥ billion) | 0.16 | 1.09 | −85.5% |
| Basic EPS (¥) | 24.63 | 168.68 | −85.4% |
JapanStockPulse provides informational content only and does not constitute investment advice. Figures are taken from the company's published earnings short report and may be subject to subsequent revision.