Growth from translation, profit from a tariff refund
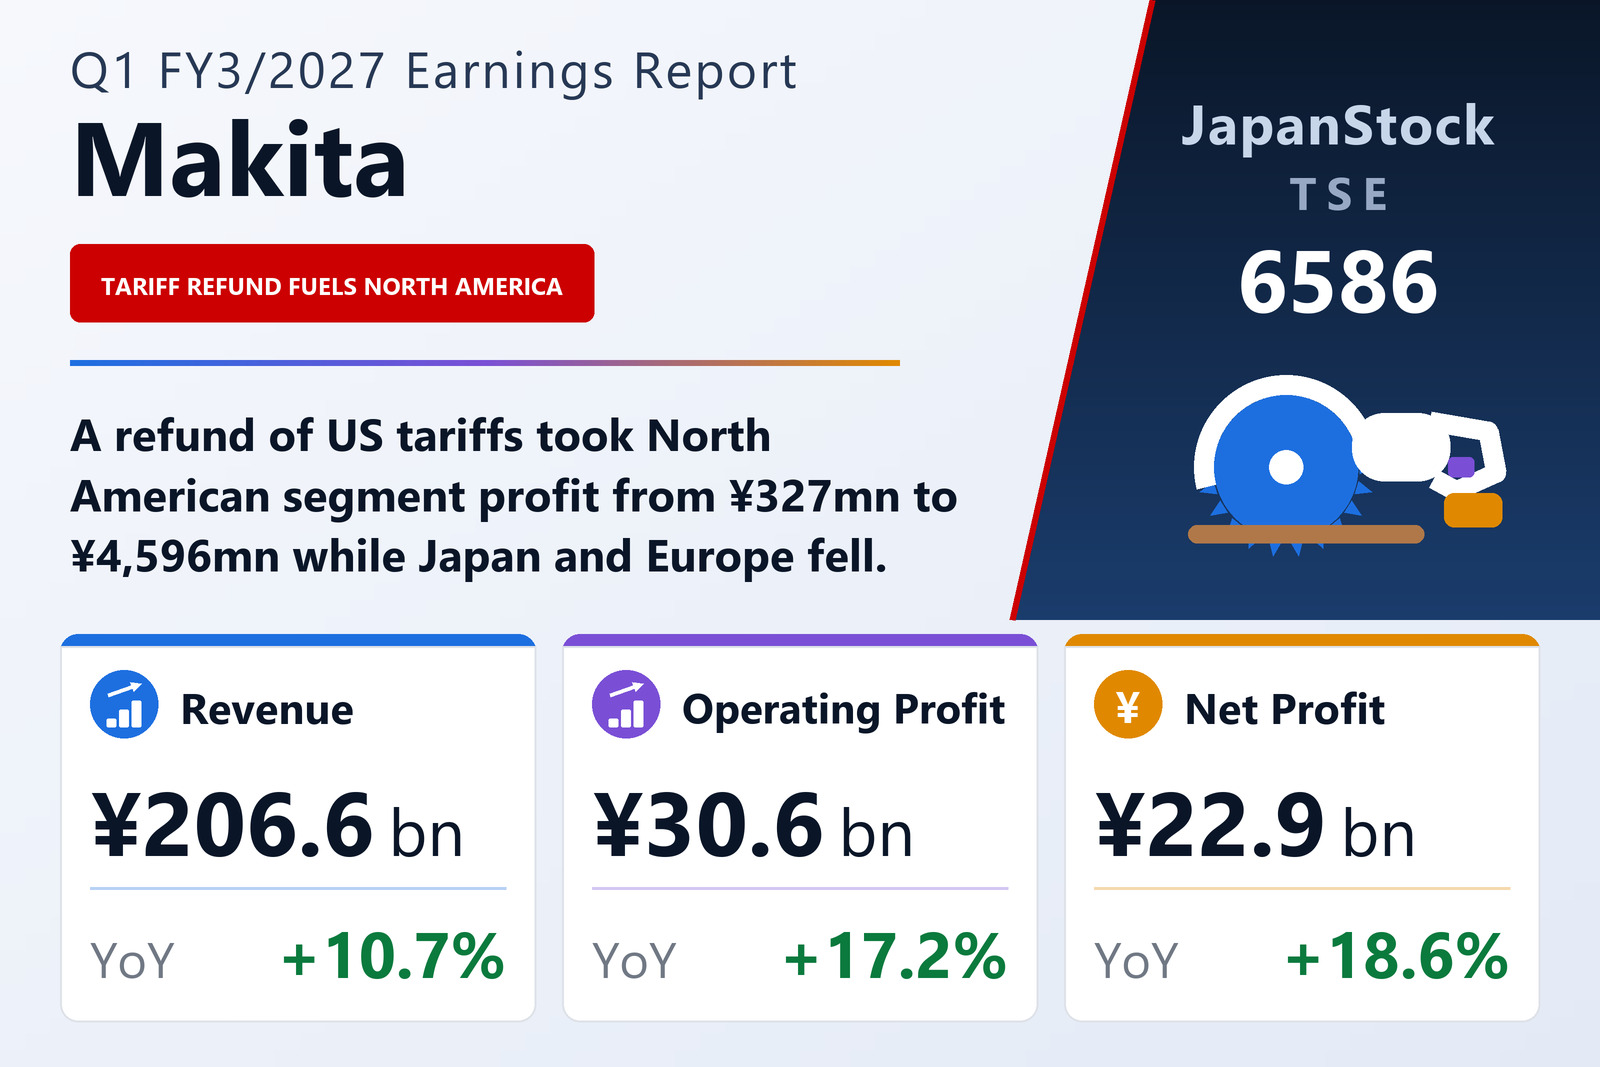
Makita Corporation (TSE: 6586) published consolidated first-quarter results for FY3/2027 on July 29, 2026, covering April 1 to June 30, 2026 under IFRS. Revenue rose 10.7% to ¥206,550 million, operating profit 17.2% to ¥30,565 million, pre-tax profit 21.5% to ¥32,645 million and profit attributable to owners of the parent 18.6% to ¥22,866 million. Earnings per share reached ¥88.70 against ¥72.07.
Management is explicit about what did and did not happen. On a local-currency basis group performance was flat year on year; the reported revenue increase comes from the weaker yen. The quarter translated at ¥159.57 to the dollar against ¥144.59, ¥185.41 to the euro against ¥163.81 and ¥23.45 to the yuan against ¥19.99. On the profit side the driver is named just as plainly: the cost ratio improved because of a refund of US tariffs.
One segment carries the quarter
The shipment-origin segment table makes the concentration obvious. North America lifted revenue 18.4% to ¥23,311 million and operating profit from ¥327 million to ¥4,596 million — a rise of more than 1,300%, and on its own larger than the group's entire ¥4,496 million profit increase. Asia added revenue up 11.3% to ¥8,906 million and profit up 13.7% to ¥6,833 million.
The two largest segments went backwards on profit. Europe grew revenue 10.8% to ¥104,042 million but saw operating profit fall 21.1% to ¥8,026 million. Japan was flat on revenue at ¥38,434 million and lost 26.4% of its profit, down to ¥6,710 million. Group-level adjustments swung from a ¥1,417 million charge to a ¥3,482 million credit.
Markets: Latin America and North America lead, the Middle East falls
Measured by end market rather than shipping origin, Latin America grew fastest at 28.1% to ¥14,816 million on XGT cordless tools and battery-powered garden equipment for agriculture, mining and infrastructure. North America rose 18.6% to ¥22,663 million, helped by a large home-centre customer's promotional tie-up with the North and Central American World Cup, even as high rates and building costs kept housing investment weak.
Europe added 11.2% to ¥103,259 million on the weak yen despite a subdued construction market and a record heatwave; Oceania rose 10.9% to ¥15,728 million; Japan managed 4.1% to ¥33,653 million as cordless garden equipment and the 40Vmax XGT lithium-ion range offset falling housing starts; Asia rose 3.0% to ¥12,173 million with Chinese property weakness spilling into neighbouring markets. Only the Middle East and Africa fell, down 10.8% to ¥4,259 million, hit by regional conflict and the closure of the Strait of Hormuz.
A fortress balance sheet, and a quadrupled interim dividend
Total assets rose ¥10,329 million to ¥1,191,514 million, chiefly on higher inventories; liabilities grew ¥897 million to ¥177,541 million; and equity rose ¥9,432 million to ¥1,013,973 million, mainly through foreign-currency translation. The equity ratio attributable to owners of the parent stands at 84.5%, up 0.1 points. Comprehensive income of ¥47,007 million was 74.5% higher, reflecting the same translation effect.
Makita set its interim dividend at ¥79.00 per share against ¥20.00 a year earlier. The year-end and full-year dividend amounts are undetermined. Employees numbered 17,672 against 17,732 a year earlier, and overseas plants accounted for 92.6% of unit production.
Guidance untouched
The company left the full-year forecast it issued on April 28 unchanged, citing an uncertain operating and currency environment: revenue of ¥820,000 million (+5.5%), operating profit of ¥110,000 million (+5.1%), pre-tax profit of ¥111,000 million (+2.8%) and profit attributable to owners of the parent of ¥81,000 million (+2.0%), for earnings per share of ¥314.22. Its full-year assumptions are ¥155 to the dollar, ¥180 to the euro and ¥22.5 to the yuan — all stronger yen than the first quarter actually delivered.
| Metric | Q1 FY3/2027 | Q1 FY3/2026 | Change |
|---|---|---|---|
| Revenue (¥ million) | 206,550 | 186,614 | +10.7% |
| Operating profit (¥ million) | 30,565 | 26,069 | +17.2% |
| Operating margin | 14.8% | 14.0% | +0.8 pt |
| Pre-tax profit (¥ million) | 32,645 | 26,865 | +21.5% |
| Net profit attrib. to owners of parent (¥ million) | 22,866 | 19,281 | +18.6% |
| Comprehensive income (¥ million) | 47,007 | 26,936 | +74.5% |
| EPS (¥) | 88.70 | 72.07 | +23.1% |
| Japan — revenue (¥ million) | 38,434 | 38,095 | +0.9% |
| Japan — segment profit (¥ million) | 6,710 | 9,112 | −26.4% |
| Europe — revenue (¥ million) | 104,042 | 93,894 | +10.8% |
| Europe — segment profit (¥ million) | 8,026 | 10,171 | −21.1% |
| North America — revenue (¥ million) | 23,311 | 19,690 | +18.4% |
| North America — segment profit (¥ million) | 4,596 | 327 | +1,305.5% |
| Asia — revenue (¥ million) | 8,906 | 7,999 | +11.3% |
| Asia — segment profit (¥ million) | 6,833 | 6,012 | +13.7% |
| Total assets (¥ million) | 1,191,514 | 1,181,185 | +0.9% |
| Equity attrib. to owners of parent (¥ million) | 1,006,541 | 997,340 | +0.9% |
| Equity ratio | 84.5% | 84.4% | +0.1 pt |
| FY3/2027 guidance — revenue (¥ million) | 820,000 | — | +5.5% |
| FY3/2027 guidance — operating profit (¥ million) | 110,000 | — | +5.1% |
| FY3/2027 guidance — pre-tax profit (¥ million) | 111,000 | — | +2.8% |
| FY3/2027 guidance — net profit (¥ million) | 81,000 | — | +2.0% |
| FY3/2027 guidance — EPS (¥) | 314.22 | — | — |
| Interim dividend per share (¥) | 79.00 | 20.00 | +295.0% |
JapanStockPulse provides informational content only and does not constitute investment advice. Figures are taken from the company's published earnings short report and may be subject to subsequent revision.