A distributor riding the AI capex cycle
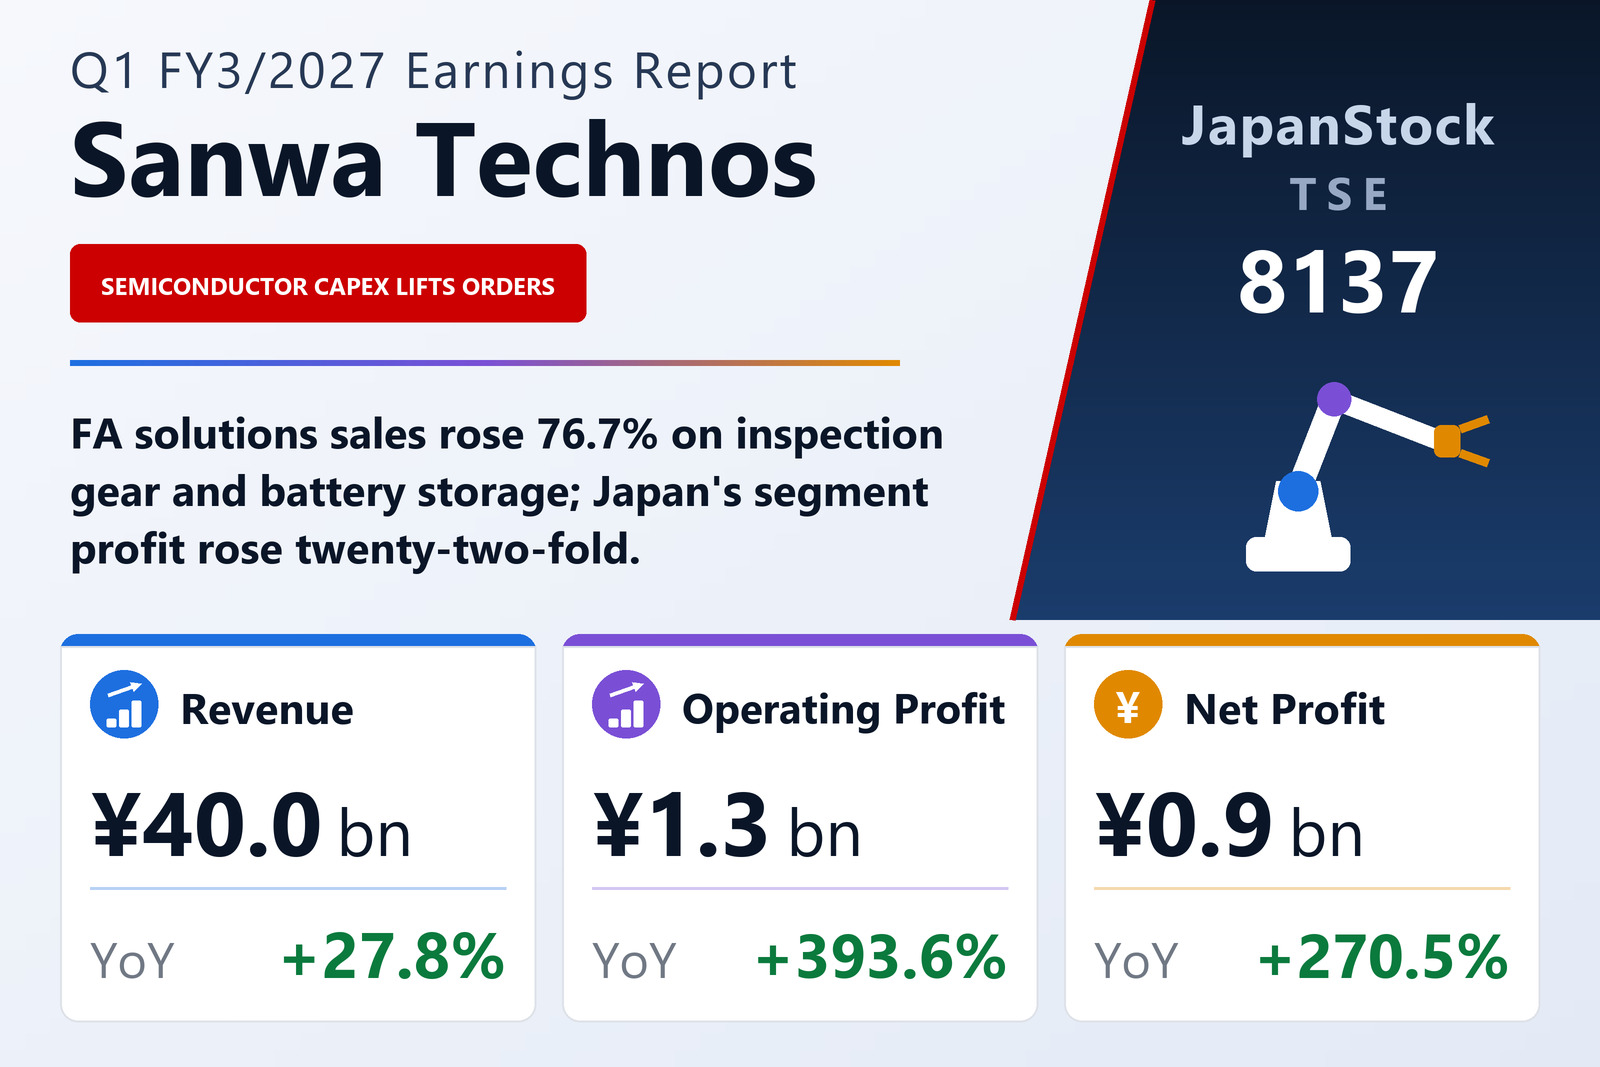
Sanwa Technos Corporation (TSE: 8137) published consolidated first-quarter results for FY3/2027 on July 29, 2026, covering April 1 to June 30, 2026 under Japanese GAAP. Net sales rose 27.8% to ¥40,035 million, operating profit 393.6% to ¥1,331 million, ordinary profit 270.7% to ¥1,403 million and net profit attributable to shareholders 270.5% to ¥908 million. Earnings per share reached ¥58.43 against ¥16.16, and comprehensive income swung from a ¥830 million deficit to ¥4,443 million.
Management describes an industrial electronics and mechatronics market in which AI-related investment has revived demand from the semiconductor-equipment industry and beyond, labour-shortage-driven automation spending continues, and decarbonisation has raised the need for grid stabilisation — producing large battery-storage projects.
Every product division grew; two grew sharply
FA Solutions was the fastest, up 76.7% to ¥4,662 million, on inspection equipment for semiconductor-equipment makers and battery-storage systems for the solar industry. Industrial PCs rose 63.6% to ¥2,903 million on semiconductor-equipment and social-infrastructure orders.
The two larger divisions grew at similar rates to each other. Electronic Components, the biggest at ¥24,158 million, rose 20.7% on optical units for the automotive sector, electronic parts for factory automation, and new liquid-crystal display business in social infrastructure. Control Devices rose 20.5% to ¥8,310 million on servo motors and wafer-transfer robots for semiconductor equipment plus sensors for the mounter industry, which is benefiting from a strong data-centre market.
Japan carries the profit; Europe and the Americas do not
By geography, Japan lifted sales 33.5% to ¥31,679 million and operating profit from ¥44 million to ¥1,022 million — a rise of 2,186.2%, and the single line that explains the group's result. Asia grew sales 23.8% to ¥12,283 million and profit 110.5% to ¥365 million on servo motors and SCARA robots for the solar industry and electronic components for factory automation.
Europe and the Americas went the other way: sales fell 5.8% to ¥1,605 million and the segment swung from a ¥40 million profit to a ¥9 million loss, as weak market conditions cut capital investment and last year's large automotive-robot order did not repeat. The residual Other segment grew sales 35.5% to ¥218 million and profit to ¥13 million.
Balance sheet expands with the business
Total assets rose ¥6,785 million to ¥108,171 million, chiefly on higher inventories and investment securities. Liabilities grew ¥3,306 million to ¥51,568 million on electronically recorded obligations, long-term borrowings and deferred tax liabilities. Net assets rose ¥3,479 million to ¥56,603 million, mostly through unrealised gains on securities, leaving the equity ratio unchanged at 52.1%.
Guidance held despite the beat
Sanwa Technos made no change to the forecast it published on May 8, 2026. The full-year plan calls for net sales of ¥173,000 million (+16.6%), operating profit of ¥6,000 million (+47.8%), ordinary profit of ¥6,200 million (+29.8%) and net profit attributable to shareholders of ¥4,200 million (+28.6%), for earnings per share of ¥270.01; the first half is planned at ¥82,300 million of sales and ¥1,900 million of net profit. The annual dividend forecast is ¥130.00 per share against ¥122.00 last year, split ¥65.00 interim and ¥65.00 final.
| Metric | Q1 FY3/2027 | Q1 FY3/2026 | Change |
|---|---|---|---|
| Net sales (¥ million) | 40,035 | 31,322 | +27.8% |
| Operating profit (¥ million) | 1,331 | 269 | +393.6% |
| Operating margin | 3.3% | 0.9% | +2.4 pt |
| Ordinary profit (¥ million) | 1,403 | 378 | +270.7% |
| Net profit attrib. to owners of parent (¥ million) | 908 | 245 | +270.5% |
| Comprehensive income (¥ million) | 4,443 | −830 | loss to profit |
| EPS (¥) | 58.43 | 16.16 | +261.6% |
| Japan — revenue (¥ million) | 31,679 | 23,725 | +33.5% |
| Japan — segment profit (¥ million) | 1,022 | 44 | +2,186.2% |
| Asia — revenue (¥ million) | 12,283 | 9,923 | +23.8% |
| Asia — segment profit (¥ million) | 365 | 173 | +110.5% |
| Europe & Americas — revenue (¥ million) | 1,605 | 1,704 | −5.8% |
| Europe & Americas — segment profit (¥ million) | −9 | 40 | profit to loss |
| Other — revenue (¥ million) | 218 | 161 | +35.5% |
| Other — segment profit (¥ million) | 13 | 2 | +446.8% |
| Electronic components division sales (¥ million) | 24,158 | — | +20.7% |
| Control devices division sales (¥ million) | 8,310 | — | +20.5% |
| Industrial PC division sales (¥ million) | 2,903 | — | +63.6% |
| FA solutions division sales (¥ million) | 4,662 | — | +76.7% |
| Total assets (¥ million) | 108,171 | 101,386 | +6.7% |
| Net assets (¥ million) | 56,603 | 53,124 | +6.5% |
| Equity ratio | 52.1% | 52.1% | unchanged |
| FY3/2027 guidance — revenue (¥ million) | 173,000 | — | +16.6% |
| FY3/2027 guidance — operating profit (¥ million) | 6,000 | — | +47.8% |
| FY3/2027 guidance — ordinary profit (¥ million) | 6,200 | — | +29.8% |
| FY3/2027 guidance — net profit (¥ million) | 4,200 | — | +28.6% |
| FY3/2027 guidance — EPS (¥) | 270.01 | — | — |
| Annual dividend per share (¥) | 130.00 | 122.00 | +6.6% |
JapanStockPulse provides informational content only and does not constitute investment advice. Figures are taken from the company's published earnings short report and may be subject to subsequent revision.