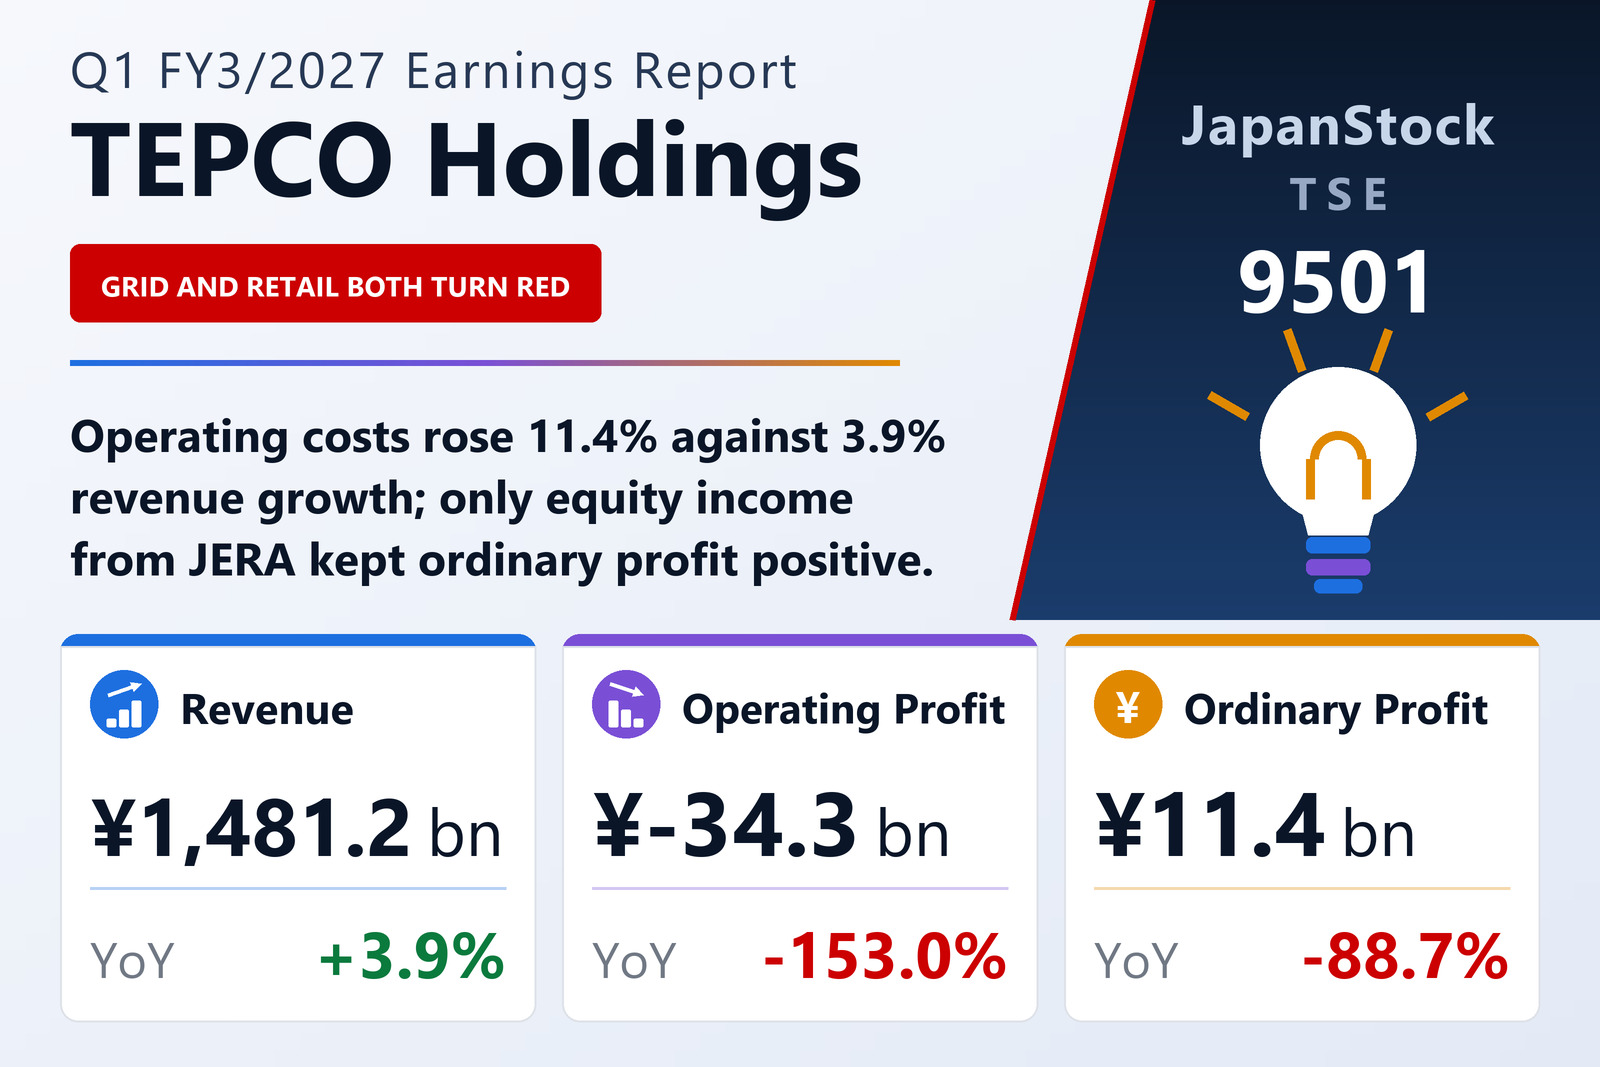
Revenue up, costs up much faster
Tokyo Electric Power Company Holdings, Inc. (TSE: 9501) published consolidated first-quarter results for FY3/2027 on July 29, 2026, covering April 1 to June 30, 2026 under Japanese GAAP. Operating revenue rose 3.9% to ¥1,481,197 million — electricity revenue ¥1,342,990 million and other revenue ¥138,207 million. Operating expenses, however, climbed 11.4% to ¥1,515,467 million, with the electricity side alone up 11.6% to ¥1,384,183 million. The gap produced an operating loss of ¥34,270 million against a ¥64,699 million profit a year earlier.
The grid and the retail arm both broke
The damage is visible in the segment table. Power Grid, the regulated transmission and distribution business, lifted revenue 14.5% to ¥592,832 million but fell from a ¥22,497 million profit to a ¥31,218 million loss. Energy Partner, the retail supplier, saw revenue fall 5.4% to ¥1,087,088 million and swung from a ¥30,601 million profit to a ¥50,932 million loss. Between them the two segments account for a ¥135.2 billion year-on-year deterioration.
The counterweights sit outside the regulated core. Fuel & Power carries almost no revenue of its own — ¥792 million — but booked ¥56,699 million of segment profit, up 43.8%, essentially the group's share of the JERA generation and fuel joint venture. Renewable Power grew revenue 22.8% to ¥71,790 million and profit 19.5% to ¥28,183 million. Holdings reported ¥302,745 million of segment profit, but that figure is dominated by dividends received from group companies: ¥293,291 million of intra-group dividends were eliminated in the ¥294,049 million consolidation adjustment, so it should not be read as operating performance.
Equity income does the work below the operating line
Non-operating income of ¥89,717 million — of which ¥77,789 million was equity-method investment income, up 35.3% — more than covered the operating loss and ¥44,019 million of non-operating expenses, leaving ordinary profit of ¥11,427 million. That is still an 88.7% fall from ¥101,275 million. Interest expense rose 29.8% to ¥29,037 million.
The comparison that flatters: last year's ¥903 billion charge
Below ordinary profit, the year-on-year picture reverses completely. This quarter carried ¥15,696 million of extraordinary losses, all nuclear damage compensation costs. A year earlier the same line held ¥954,977 million — ¥903,046 million of disaster-related special losses plus ¥51,931 million of compensation. The result: a pre-tax loss of ¥4,327 million against ¥854,151 million, and a net loss attributable to shareholders of ¥9,793 million against ¥857,690 million. Loss per share was ¥6.11 against ¥535.36, and comprehensive income turned positive at ¥6,128 million from a ¥925,787 million deficit.
Balance sheet steady, guidance still impossible
Total assets fell 1.3% to ¥15,370,282 million while net assets edged up 0.2% to ¥3,424,452 million, lifting the equity ratio 0.3 points to 22.1%. The dividend remains ¥0.00 for both the year just ended and the year in progress.
TEPCO again declined to publish full-year guidance. The company said that, with fuel-price visibility clouded by the Middle East situation, it is not in a position to present concrete forecasts, and that revenue, operating profit or loss, ordinary profit or loss and net profit or loss attributable to shareholders are all undetermined. It will publish figures as soon as the outlook allows.
| Metric | Q1 FY3/2027 | Q1 FY3/2026 | Change |
|---|---|---|---|
| Net sales (¥ million) | 1,481,197 | 1,425,123 | +3.9% |
| Operating expenses (¥ million) | 1,515,467 | 1,360,423 | +11.4% |
| Operating profit (¥ million) | −34,270 | 64,699 | profit to loss |
| Equity-method investment income (¥ million) | 77,789 | 57,493 | +35.3% |
| Ordinary profit (¥ million) | 11,427 | 101,275 | −88.7% |
| Extraordinary losses (¥ million) | 15,696 | 954,977 | −98.4% |
| Net profit attrib. to owners of parent (¥ million) | −9,793 | −857,690 | loss narrowed |
| Comprehensive income (¥ million) | 6,128 | −925,787 | loss to profit |
| EPS (¥) | −6.11 | −535.36 | loss narrowed |
| Fuel & Power — revenue (¥ million) | 792 | 924 | −14.3% |
| Fuel & Power — segment profit (¥ million) | 56,699 | 39,442 | +43.8% |
| Power Grid — revenue (¥ million) | 592,832 | 517,799 | +14.5% |
| Power Grid — segment profit (¥ million) | −31,218 | 22,497 | profit to loss |
| Energy Partner (retail) — revenue (¥ million) | 1,087,088 | 1,149,659 | −5.4% |
| Energy Partner (retail) — segment profit (¥ million) | −50,932 | 30,601 | profit to loss |
| Renewable Power — revenue (¥ million) | 71,790 | 58,484 | +22.8% |
| Renewable Power — segment profit (¥ million) | 28,183 | 23,585 | +19.5% |
| Total assets (¥ million) | 15,370,282 | 15,575,602 | −1.3% |
| Net assets (¥ million) | 3,424,452 | 3,418,351 | +0.2% |
| Shareholders' equity (¥ million) | 3,395,756 | 3,389,645 | +0.2% |
| Equity ratio | 22.1% | 21.8% | +0.3 pt |
JapanStockPulse provides informational content only and does not constitute investment advice. Figures are taken from the company's published earnings short report and may be subject to subsequent revision.