A new name, and a quarter that ran ahead of it
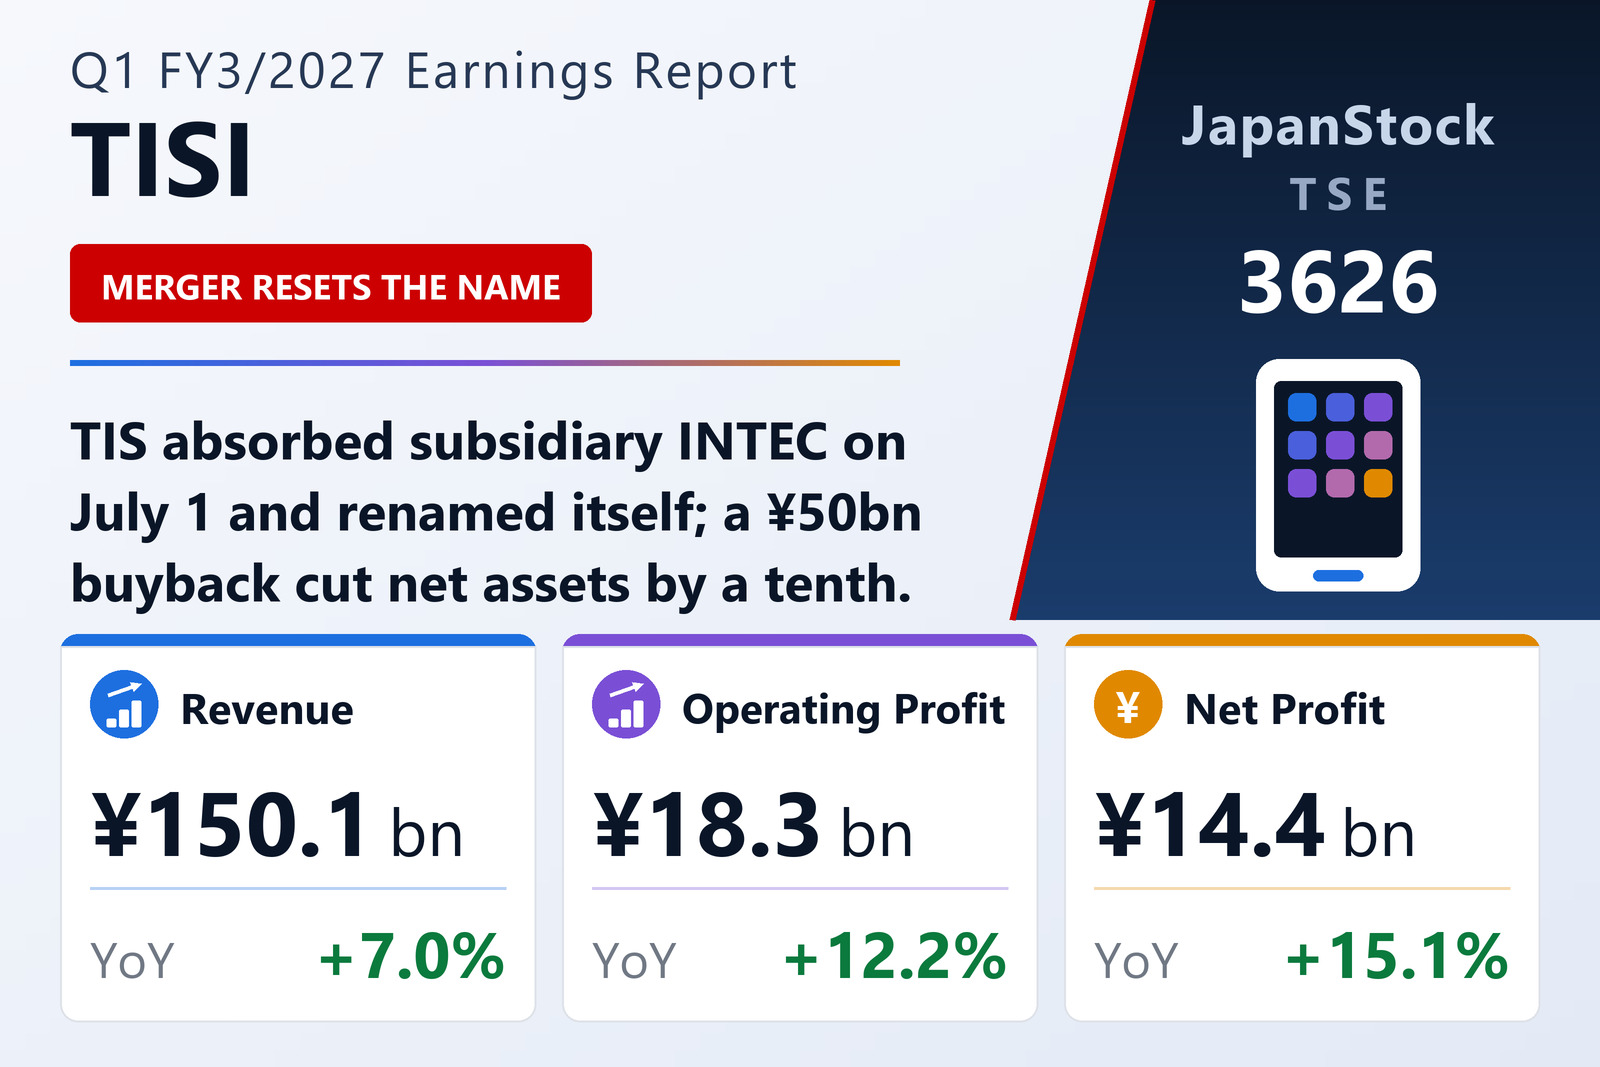
TISI Inc. (TSE: 3626) published consolidated first-quarter results for FY3/2027 on July 30, 2026, covering April 1 to June 30, 2026 under Japanese GAAP. Revenue rose 7.0% to ¥150,111 million, gross profit 7.4% to ¥41,403 million, and operating profit 12.2% to ¥18,347 million. Net profit attributable to owners of parent climbed 15.1% to ¥14,409 million and earnings per share to ¥67.41 from ¥54.02.
The name is new. On July 1, 2026 the company absorbed its wholly owned subsidiary INTEC Inc. and changed its trade name from TIS to TISI, launching under a new structure; at the general meeting of June 23 it also converted to a company with an audit and supervisory committee. Because INTEC was already consolidated, the merger changes nothing in these figures beyond ¥190 million of merger-related costs booked in selling, general and administrative expenses and ¥120 million in non-operating expenses. The full-year plan carries about ¥1.6 billion of such SG&A costs and ¥0.6 billion of non-operating costs, roughly ¥1.5 billion and ¥0.2 billion more than last year.
The operating leverage came from cost discipline rather than pricing. Gross margin improved only 0.1 point to 27.6%, but SG&A grew just 3.8% against 7.0% revenue growth, and that gap alone accounts for the operating margin widening 0.5 points to 12.2%. Management frames the quarter as growth investment — above all in people — funded by high-value-added work and productivity measures.
Four segments up, one flat, one down
Industrial IT was the standout: revenue up 5.3% to ¥34,077 million but segment profit up 21.4% to ¥6,201 million, lifting its margin 2.4 points to 18.2% — the highest of any segment — as IT investment expanded across manufacturing and services. Financial IT grew revenue 9.2% to ¥25,801 million and profit 18.4% to ¥3,528 million on deeper penetration of core credit-card clients and modernisation work, with margin up 1.1 points to 13.7%.
Wide-area IT Solutions, the largest segment at ¥45,855 million, grew revenue 4.7% and profit 9.0% to ¥5,271 million across insurance, healthcare and modernisation demand. BPM was essentially flat — revenue up 3.4%, profit up 1.0% — and the small Other segment grew profit 36.9% to ¥267 million.
The exception is the segment that grew fastest on the top line. Offering Services lifted revenue 9.9% to ¥39,831 million but saw profit fall 5.0% to ¥1,643 million, its margin narrowing 0.7 points to 4.1% — by some distance the thinnest in the group. The company attributes this to up-front investment in the payments field and lower profitability in the overseas business. Given that this is the segment built on TISI's own service platforms, and the one the strategy leans on, a fifth consecutive quarter of margin below 5% is the number to watch.
¥50 billion of buybacks, and a balance sheet that shows it
Between March and May 2026 TISI repurchased approximately ¥50 billion of its own shares (14,368,400 shares), and on July 30, 2026 — the same day as these results — the board resolved to cancel 13,700,000 of them, equivalent to the ¥50 billion, under a policy of holding no more than 5% of shares issued in treasury. The buyback included ¥8.2 billion representing the FY3/2027 portion of a 50% total-return-ratio policy, and is framed against medium-term targets of ROE above 16% and EPS growth averaging over 10% a year.
The effect on the balance sheet is direct. Net assets fell 9.9% to ¥304,235 million even though retained earnings rose ¥5,117 million (net profit of ¥14,409 million less ¥9,291 million of dividends), because treasury stock grew ¥35,735 million. Total assets fell 4.9% to ¥524,657 million as trade receivables shrank ¥22,850 million on collections and securities ¥9,356 million on redemptions. Liabilities rose 3.1% to ¥220,422 million: short-term borrowings grew ¥29,979 million while income taxes payable fell ¥11,968 million, the bonus provision ¥8,813 million and a litigation-loss provision ¥7,434 million as the underlying suit was resolved. The equity ratio ended at 55.7%, down 3.2 points.
The share count is why earnings per share grew 24.8% against 15.1% net-profit growth: average shares outstanding fell 7.8% to 213,755,651 from 231,771,045, with treasury holdings more than doubling to 18,472,727 from 8,325,746.
Guidance unchanged, and an AI-shaped next plan
TISI left the May 8, 2026 forecast in place: full-year revenue of ¥620,000 million (+3.9%), operating profit of ¥81,000 million (+6.3%), ordinary profit of ¥81,000 million (+5.9%) and net profit of ¥57,000 million (+22.3%), for earnings per share of ¥271.70. Note that the net-profit line embeds an assumed ¥5.0 billion extraordinary gain from planned sales of investment securities; ¥2.48 billion of that was already realised this quarter through the reduction of cross-shareholdings, within ¥2.84 billion of total extraordinary gains against ¥0.19 billion of losses.
Ahead of a new medium-term plan starting next fiscal year, management named three priorities, all built on artificial intelligence: a qualitative shift in earnings through AI-driven development; growth in recurring revenue from Vertical AI services — industry-specific agent-based AI; and diversification of the revenue model through strategic investment in focus areas. Two brands carry the effort, IntegriA for end-to-end enterprise AI adoption and PAYCIERGE for a next-generation payments platform pairing payment-specific Vertical AI with specialist staff. The annual dividend is planned at ¥90.00 against ¥80.00, split ¥45.00 and ¥45.00.
| Metric | Q1 FY3/2027 | Q1 FY3/2026 | Change |
|---|---|---|---|
| Revenue (¥ million) | 150,111 | 140,316 | +7.0% |
| Gross profit (¥ million) | 41,403 | 38,568 | +7.4% |
| Gross margin | 27.6% | 27.5% | +0.1 pt |
| SG&A expenses (¥ million) | 23,056 | 22,214 | +3.8% |
| Operating profit (¥ million) | 18,347 | 16,353 | +12.2% |
| Operating margin | 12.2% | 11.7% | +0.5 pt |
| Ordinary profit (¥ million) | 18,424 | 17,064 | +8.0% |
| Net profit attrib. to owners of parent (¥ million) | 14,409 | 12,520 | +15.1% |
| Comprehensive income (¥ million) | 13,137 | 15,170 | −13.4% |
| EPS (¥) | 67.41 | 54.02 | +24.8% |
| Offering Services — revenue (¥ million) | 39,831 | 36,246 | +9.9% |
| Offering Services — segment profit (¥ million) | 1,643 | 1,730 | −5.0% |
| BPM — revenue (¥ million) | 11,050 | 10,686 | +3.4% |
| BPM — segment profit (¥ million) | 1,437 | 1,423 | +1.0% |
| Financial IT — revenue (¥ million) | 25,801 | 23,631 | +9.2% |
| Financial IT — segment profit (¥ million) | 3,528 | 2,979 | +18.4% |
| Industrial IT — revenue (¥ million) | 34,077 | 32,349 | +5.3% |
| Industrial IT — segment profit (¥ million) | 6,201 | 5,107 | +21.4% |
| Wide-area IT Solutions — revenue (¥ million) | 45,855 | 43,800 | +4.7% |
| Wide-area IT Solutions — segment profit (¥ million) | 5,271 | 4,837 | +9.0% |
| Other — revenue (¥ million) | 2,676 | 2,522 | +6.1% |
| Other — segment profit (¥ million) | 267 | 195 | +36.9% |
| Total assets (¥ million) | 524,657 | 551,507 | −4.9% |
| Total liabilities (¥ million) | 220,422 | 213,780 | +3.1% |
| Net assets (¥ million) | 304,235 | 337,726 | −9.9% |
| Shareholders' equity (¥ million) | 292,441 | 324,730 | −9.9% |
| Equity ratio | 55.7% | 58.9% | −3.2 pt |
| FY3/2027 guidance — revenue (¥ million) | 620,000 | — | +3.9% |
| FY3/2027 guidance — operating profit (¥ million) | 81,000 | — | +6.3% |
| FY3/2027 guidance — ordinary profit (¥ million) | 81,000 | — | +5.9% |
| FY3/2027 guidance — net profit (¥ million) | 57,000 | — | +22.3% |
| FY3/2027 guidance — EPS (¥) | 271.70 | — | — |
| Annual dividend per share (¥) | 90.00 | 80.00 | +12.5% |
JapanStockPulse provides informational content only and does not constitute investment advice. Figures are taken from the company's published earnings short report and may be subject to subsequent revision.