The year the majority of sales moved offshore
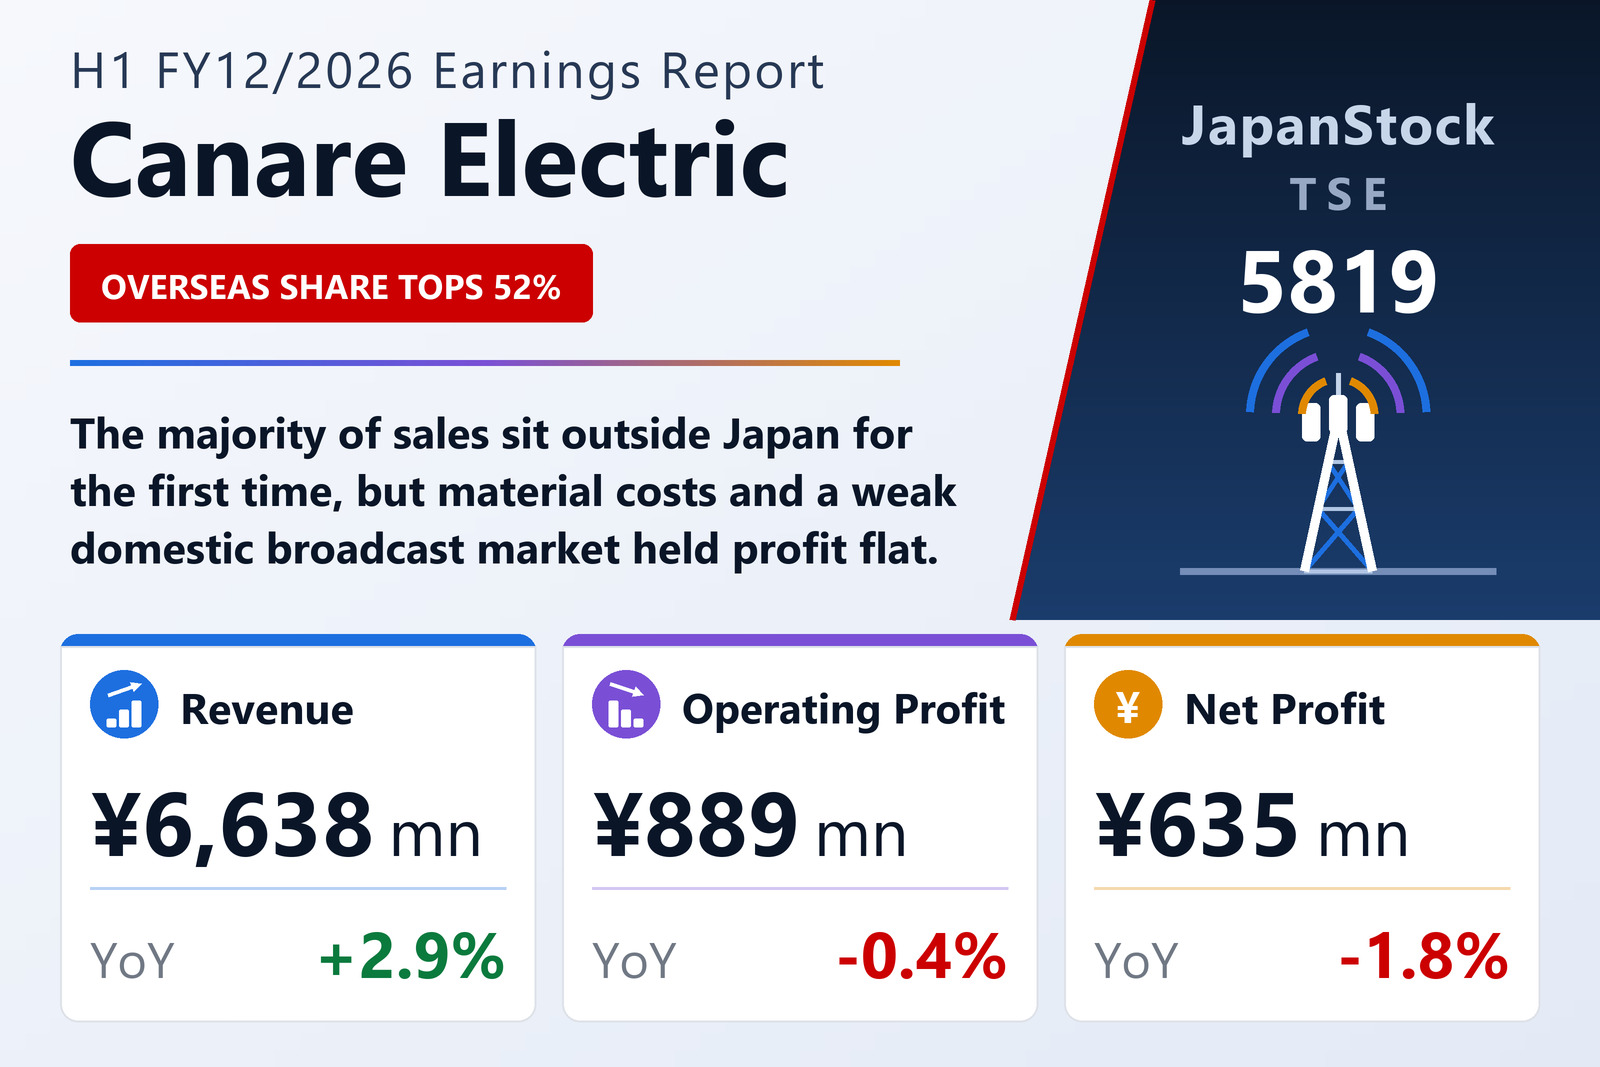
Canare Electric Co., Ltd. (TSE: 5819) published consolidated results for the first half of FY12/2026 on July 30, 2026, covering January 1 to June 30, 2026 under Japanese GAAP. Revenue rose 2.9% to ¥6,638 million, while operating profit fell 0.4% to ¥889 million, ordinary profit 0.5% to ¥929 million and net profit attributable to owners of parent 1.8% to ¥635 million. Earnings per share were ¥92.77 against ¥94.78.
The structural line is the geographic one. Overseas sales, classified by customer location, rose 9.5% to ¥3,503 million and reached 52.8% of consolidated revenue, up from 49.6% — the first time the majority of Canare's business has sat outside Japan. The Americas contributed 14.7% of group revenue (up from 13.0%), Asia 25.9% (from 25.6%) and other regions 12.2% (from 11.0%). Every regional bucket gained share; the domestic base gave it up.
Management is explicit about why profit did not follow revenue. Gross margin fell on surging material prices, and the company continued to spend on aggressive sales promotion, product development and human-capital investment for sustained growth. The combination pushed operating, ordinary and net profit all slightly lower on higher revenue — a deliberate trade rather than an operational miss.
Japan gave up profit; the United States more than made it up
Japan, still the largest single market, saw revenue fall 4.0% to ¥3,221 million and segment profit 19.4% to ¥595 million — a decline of ¥143 million, larger than the entire group's ¥4 million profit shortfall, meaning every other region combined was positive. The electrical installation market was solid, with construction materials and broadcast relay equipment for sports events centred on Asia, plus steady work for event and entertainment facilities. The broadcast market was the problem: deliveries including the interior works for Miyazaki Broadcasting's new building could not replace the NHK project booked in the prior period.
The United States was the standout: revenue up 16.9% to ¥978 million and segment profit up 588.2% to ¥165 million from ¥24 million. Steady deliveries of video-production equipment replacement projects in the broadcast market and to systems integrators and dealers drove the top line, currency helped, and — the specific driver of that profit multiple — tariff refunds reduced import costs. It is worth naming that as a discrete, policy-dependent item rather than an underlying margin shift.
South Korea grew revenue 19.2% to ¥579 million and profit 43.1% to ¥59 million: capital spending was cautious around the unified local elections, but deliveries to arenas and performance venues concentrated in the later part of the period, winning orders across broadcast, electrical installation and distribution. Singapore, covering South-East Asia, grew revenue 16.0% to ¥311 million and profit 90.6% to ¥27 million on firm demand for live sports and event facilities, despite some project postponements from regional slowdown.
China went the other way on revenue, down 4.9% to ¥602 million, as economic deceleration held back capital-investment demand overall, even though broadcast-station equipment renewal and 4K systems for large facilities progressed; segment profit nonetheless rose 42.1% to ¥37 million. The residual Other segment — India, Europe and the Middle East — grew revenue 8.6% to ¥881 million but saw profit fall 34.6% to ¥67 million, the only region where earnings went backwards alongside Japan.
A balance sheet with almost no liabilities
Total assets rose 1.0% to ¥21,279 million, as receivables, investment securities and long-term deposits grew against lower cash after tax and dividend payments. Liabilities fell 17.7% to ¥1,667 million on lower accounts payable and income taxes payable — leaving the company with liabilities equal to just 7.8% of assets. Net assets rose 3.0% to ¥19,611 million on retained earnings and translation adjustments, and the equity ratio reached 92.2%, up 1.8 points, with net assets per share at ¥2,858.59 against ¥2,784.46.
A full-year plan that still implies a weaker second half
Canare left the full-year forecast published on January 29, 2026 unchanged: revenue of ¥13,200 million (+0.6%), operating profit of ¥1,480 million (−6.4%), ordinary profit of ¥1,630 million (−2.8%) and net profit of ¥1,180 million (−1.7%), for earnings per share of ¥172.68. The company notes that Middle East conditions caused some shipment delays in the half but that the impact was limited, while adding that the outlook and its earnings effect remain unclear.
The implied second half is the number to hold onto. Guidance requires revenue of ¥6,562 million and operating profit of ¥591 million in the six months to December — that is 1.1% less revenue than the first half just delivered, and 33.5% less operating profit. Either the plan embeds a materially weaker second half than the first, or it is conservative; the company has given no indication of revising it. The annual dividend is unchanged at ¥66.00, with ¥33.00 already declared as the interim payment against ¥28.00 a year earlier and ¥33.00 forecast at year-end against ¥38.00 — the same total, more evenly split. The interim payment starts on September 14, 2026.
| Metric | H1 FY12/2026 | H1 FY12/2025 | Change |
|---|---|---|---|
| Revenue (¥ million) | 6,638 | 6,452 | +2.9% |
| Operating profit (¥ million) | 889 | 893 | −0.4% |
| Operating margin | 13.40% | 13.85% | −0.45 pt |
| Ordinary profit (¥ million) | 929 | 933 | −0.5% |
| Net profit attrib. to owners of parent (¥ million) | 635 | 646 | −1.8% |
| Comprehensive income (¥ million) | 787 | 509 | +54.5% |
| EPS (¥) | 92.77 | 94.78 | −2.1% |
| Japan — revenue (¥ million) | 3,221 | 3,356 | −4.0% |
| Japan — segment profit (¥ million) | 595 | 738 | −19.4% |
| United States — revenue (¥ million) | 978 | 837 | +16.9% |
| United States — segment profit (¥ million) | 165 | 24 | +588.2% |
| South Korea — revenue (¥ million) | 579 | 486 | +19.2% |
| South Korea — segment profit (¥ million) | 59 | 41 | +43.1% |
| China — revenue (¥ million) | 602 | 634 | −4.9% |
| China — segment profit (¥ million) | 37 | 26 | +42.1% |
| Singapore — revenue (¥ million) | 311 | 268 | +16.0% |
| Singapore — segment profit (¥ million) | 27 | 14 | +90.6% |
| Other (India, Europe, Middle East) — revenue (¥ million) | 881 | 811 | +8.6% |
| Other (India, Europe, Middle East) — segment profit (¥ million) | 67 | 102 | −34.6% |
| Overseas sales (¥ million) | 3,503 | 3,198 | +9.5% |
| Overseas share of consolidated revenue | 52.8% | 49.6% | +3.2 pt |
| Total assets (¥ million) | 21,279 | 21,075 | +1.0% |
| Total liabilities (¥ million) | 1,667 | 2,025 | −17.7% |
| Net assets (¥ million) | 19,611 | 19,048 | +3.0% |
| Equity ratio | 92.2% | 90.4% | +1.8 pt |
| Net assets per share (¥) | 2,858.59 | 2,784.46 | +2.7% |
| FY12/2026 guidance — revenue (¥ million) | 13,200 | — | +0.6% |
| FY12/2026 guidance — operating profit (¥ million) | 1,480 | — | −6.4% |
| FY12/2026 guidance — ordinary profit (¥ million) | 1,630 | — | −2.8% |
| FY12/2026 guidance — net profit (¥ million) | 1,180 | — | −1.7% |
| FY12/2026 guidance — EPS (¥) | 172.68 | — | — |
| Annual dividend per share (¥) | 66.00 | 66.00 | unchanged |
JapanStockPulse provides informational content only and does not constitute investment advice. Figures are taken from the company's published earnings short report and may be subject to subsequent revision.