Bigger deals, not just more of them
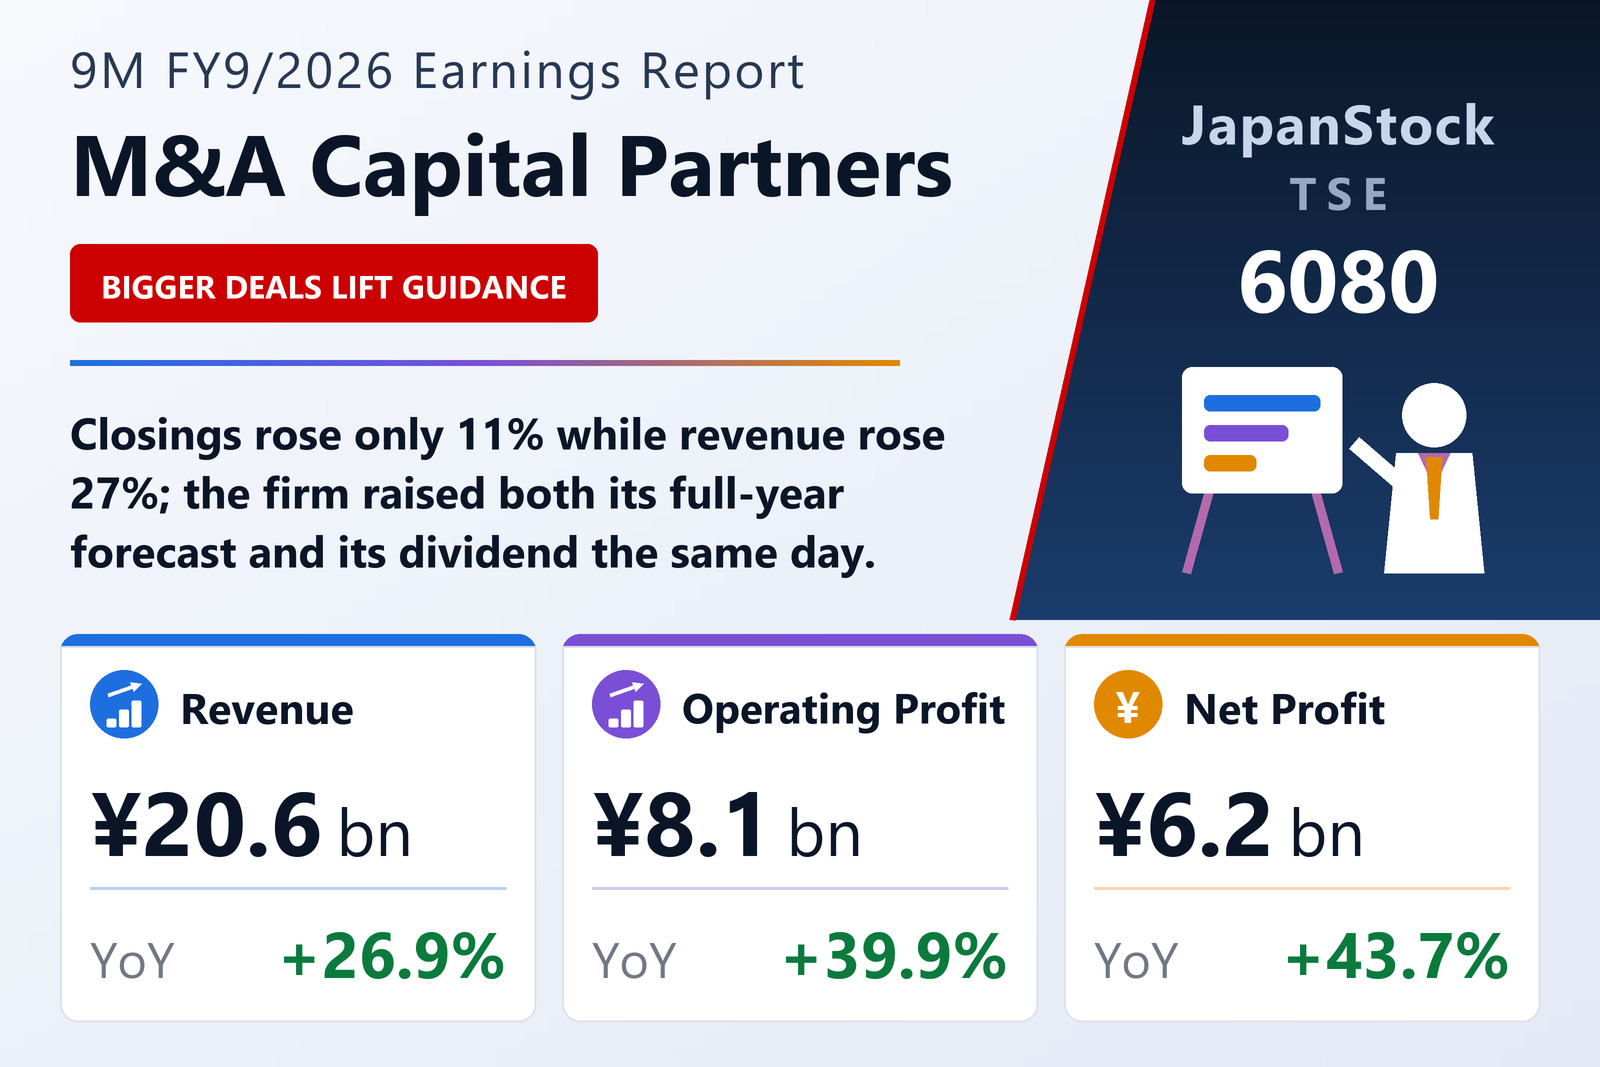
M&A Capital Partners Co., Ltd. (TSE: 6080) published consolidated results for the first nine months of FY9/2026 on July 30, 2026, covering October 1, 2025 to June 30, 2026 under IFRS. Revenue rose 26.9% to ¥20,641 million, operating profit 39.9% to ¥8,109 million, pre-tax profit 42.1% to ¥8,257 million, and profit attributable to owners of parent 43.7% to ¥6,208 million. Basic earnings per share reached ¥195.45 against ¥136.03.
The composition of that growth is the story. Group closings rose to 201 from 181, an 11.0% increase — but revenue rose 26.9%. The company attributes the gap to large, high-unit-price deals closing and lifting the average fee per transaction sharply. The count of deals earning fees of ¥100 million or more barely moved, from 44 to 45; the growth in volume came in the sub-¥100 million bracket, from 137 to 156. So the revenue lift is not a matter of more large deals, but of the large deals being larger.
Within the group the two brands diverged. The parent company itself closed 191 deals against 169, with its sub-¥100 million bracket rising from 127 to 147 and its ¥100 million-plus bracket from 42 to 44. Subsidiary RECOF Corporation went the other way, closing 10 deals against 12, with its ¥100 million-plus count falling from 2 to 1 — a small absolute movement, but the only part of the franchise moving backwards.
Management points to the IB Coverage Department, established in October 2024 to run large, specialist financial-advisory mandates, as a structural driver: it says the pipeline of high-unit-price FA work has grown and closings are beginning to come through, which it expects to expand further. The firm also maintains a consultant cohort centred on holders of accountant, lawyer and tax-accountant qualifications, and ties its training programme to the bonus system.
Operating leverage that is unusually clean
Cost of sales rose 25.8% to ¥7,492 million — essentially in line with revenue, since bonuses and bonus provisions move with billings, alongside higher outsourcing costs. That left gross profit up 27.6% at ¥13,149 million and the gross margin roughly flat at 63.7%.
The margin expansion happened one line lower. Selling, general and administrative expenses rose only 11.8% to ¥5,037 million — on higher director bonus provisions, advertising, fees and sundry costs — against 26.9% revenue growth. That 15-point gap is the entire source of the 3.63-point improvement in operating margin, to 39.29%. Comprehensive income rose faster still, up 70.7% to ¥5,929 million.
A market that keeps setting records
The backdrop remains supportive. According to data compiled by group company RECOF Data, announced M&A transactions involving Japanese companies reached 5,115 in calendar 2025, up 8.8% and a record for the second consecutive year; the first half of 2026 recorded 2,647, up 5.1%, a third consecutive record. Separately, the Small and Medium Enterprise Agency's tally of deals reported by registered support institutions rose about 5.5%, from 4,681 in fiscal 2023 to 4,940 in fiscal 2024.
The company also addresses the industry's reputational problem directly. It notes that the influx of new intermediaries into the unlisted mid-market produced cases of inappropriate M&A advice, and argues that the SME Agency's third-edition Small and Medium M&A Guidelines — together with a published mission, ethics and skills map for individual practitioners, now applied to every firm on the support-institution register — have taken hold as industry norms and are driving consolidation of standards.
Balance sheet, and a guidance raise made on Q4 visibility
Current assets rose 7.1% to ¥50,227 million, chiefly on ¥3,878 million more cash and equivalents; non-current assets fell 7.4% to ¥8,200 million as right-of-use assets declined ¥718 million and deferred tax assets ¥467 million. Current liabilities fell 3.2% to ¥7,772 million and non-current liabilities 33.8% to ¥2,953 million, mainly on ¥851 million less lease liability and ¥499 million less deferred tax liability. Total equity rose 10.2% to ¥47,703 million on ¥4,555 million of retained earnings, lifting the equity ratio 4.0 points to 81.6%.
The forecast revision was published the same day. Full-year FY9/2026 guidance now stands at revenue of ¥28,328 million (+26.2%), operating profit of ¥10,891 million (+52.8%), pre-tax profit of ¥11,089 million (+54.0%) and net profit of ¥7,677 million (+51.4%), for earnings per share of ¥241.58 — every line above the previous forecast. Management says the raise follows a careful review of deals expected to close in the fourth quarter, given results ahead of the prior year and sufficient deal inventory.
Note what the guidance implies about the final quarter: it requires ¥7,687 million of revenue and ¥2,782 million of operating profit in three months, against ¥6,880 million and ¥2,703 million per quarter on average so far — a step up, but a modest one relative to the beat already delivered. The annual dividend forecast was revised at the same time to ¥72.47, all paid at year-end, from ¥52.10 for FY9/2025 — a 39.1% increase, slower than the 51.4% profit growth guided, which leaves the payout ratio easing rather than rising.
| Metric | 9M FY9/2026 | 9M FY9/2025 | Change |
|---|---|---|---|
| Revenue (¥ million) | 20,641 | 16,260 | +26.9% |
| Gross profit (¥ million) | 13,149 | 10,303 | +27.6% |
| SG&A expenses (¥ million) | 5,037 | 4,507 | +11.8% |
| Operating profit (¥ million) | 8,109 | 5,798 | +39.9% |
| Operating margin | 39.29% | 35.66% | +3.63 pt |
| Pre-tax profit (¥ million) | 8,257 | 5,810 | +42.1% |
| Net profit attrib. to owners of parent (¥ million) | 6,208 | 4,320 | +43.7% |
| Comprehensive income (¥ million) | 5,929 | 3,474 | +70.7% |
| EPS (¥) | 195.45 | 136.03 | +43.7% |
| Deals closed, group (number) | 201 | 181 | +11.0% |
| — of which fees of ¥100 million or more (number) | 45 | 44 | +2.3% |
| M&A Capital Partners parent-only deals closed (number) | 191 | 169 | +13.0% |
| Total assets (¥ million) | 58,428 | 55,773 | +4.8% |
| Equity attrib. to owners of parent (¥ million) | 47,703 | 43,283 | +10.2% |
| Equity ratio | 81.6% | 77.6% | +4.0 pt |
| FY9/2026 guidance — revenue (¥ million) | 28,328 | — | +26.2% |
| FY9/2026 guidance — operating profit (¥ million) | 10,891 | — | +52.8% |
| FY9/2026 guidance — pre-tax profit (¥ million) | 11,089 | — | +54.0% |
| FY9/2026 guidance — net profit (¥ million) | 7,677 | — | +51.4% |
| FY9/2026 guidance — EPS (¥) | 241.58 | — | — |
| Annual dividend per share (¥) | 72.47 | 52.10 | +39.1% |
JapanStockPulse provides informational content only and does not constitute investment advice. Figures are taken from the company's published earnings short report and may be subject to subsequent revision.