The largest revenue jump in years, and where it went
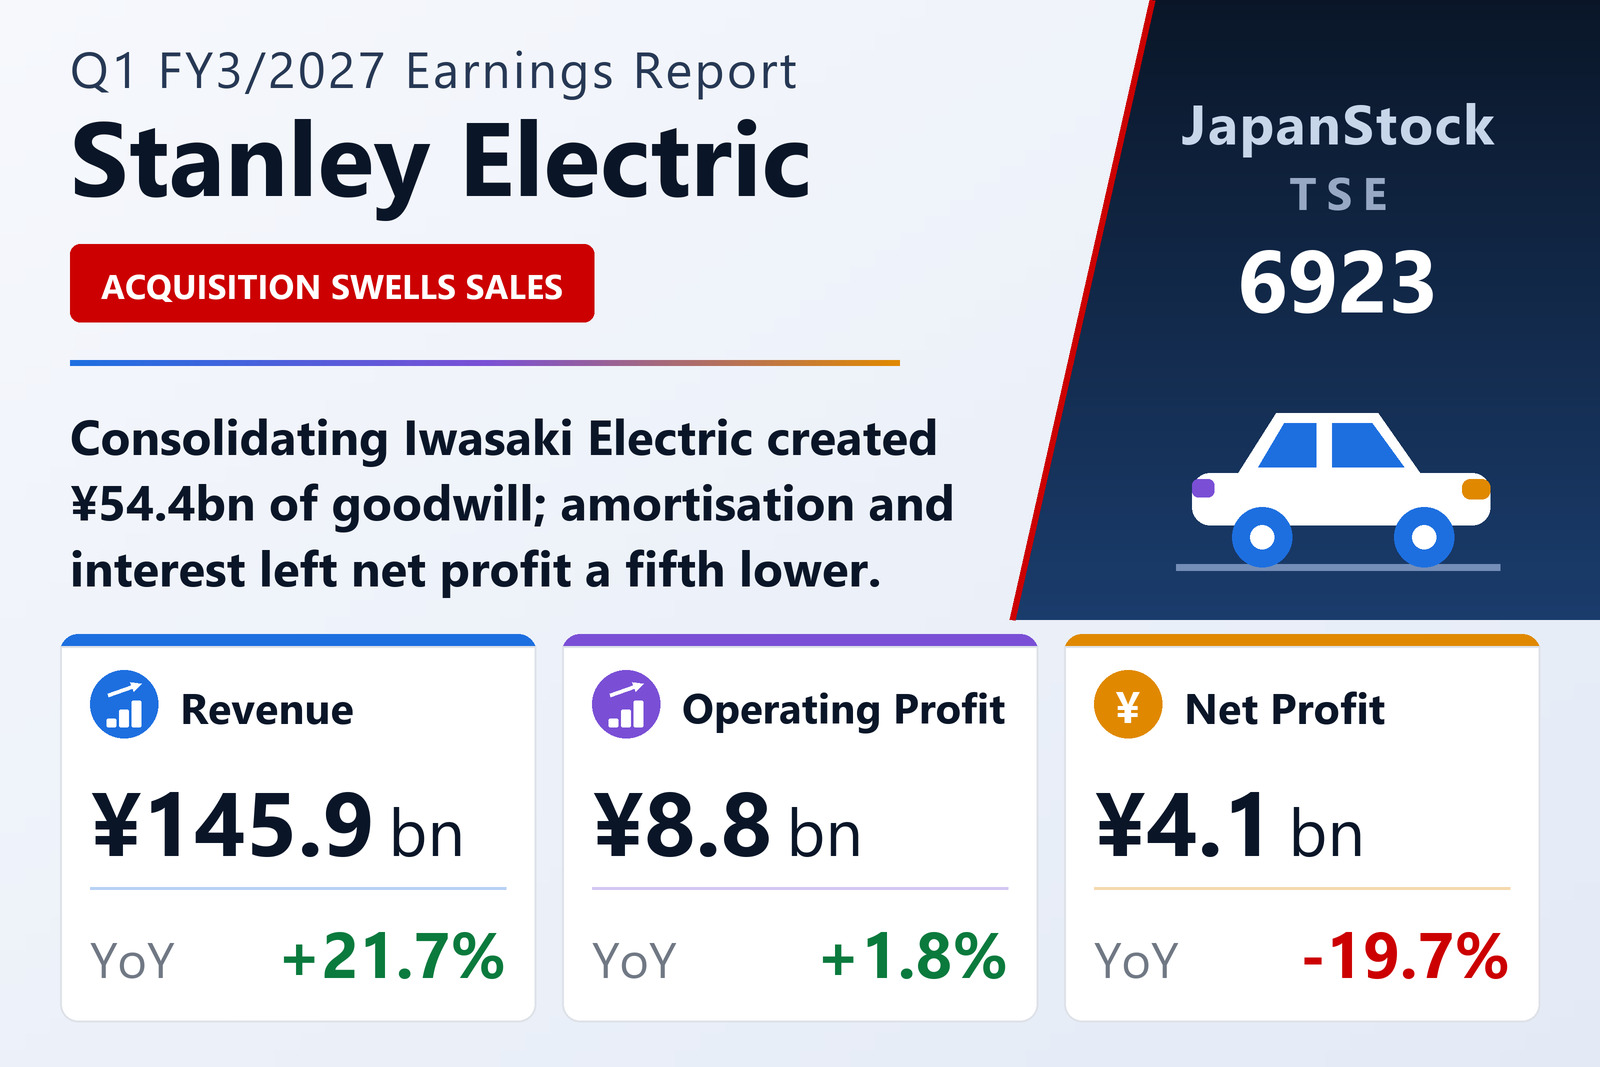
Stanley Electric Co., Ltd. (TSE: 6923) published consolidated first-quarter results for FY3/2027 on July 30, 2026, covering April 1 to June 30, 2026 under Japanese GAAP. Revenue rose 21.7% to ¥145,856 million against a 1.3% decline a year earlier — a swing of 23 points, and almost entirely a consolidation effect. During the quarter the company acquired all shares of Iwasaki Electric Co., Ltd. and included it in the scope of consolidation, alongside the start of operations at Stanley Mobility Electric K.K.
Both new units land in the same segment. Electronic Application Products revenue rose 75.4% to ¥48,407 million, from ¥27,600 million — an increase of ¥20,807 million that on its own is 80% of the group's ¥26,018 million revenue gain. Yet the same segment's profit fell 41.0% to ¥1,268 million from ¥2,148 million, because the business combination brought goodwill amortisation with it. Management adds a seasonality caveat: Iwasaki's revenue and operating profit concentrate in the second half, so its profit contribution this quarter was limited even though its performance is tracking the full-year plan.
The legacy businesses did what they were supposed to. Automotive Equipment — lamps for cars and motorcycles, and still 77% of group revenue — grew 8.7% to ¥111,986 million with segment profit up 6.4% to ¥10,025 million, as strong sales in the Americas and a weaker yen offset a difficult Chinese market. Motorcycle lamps held up across Asia. Components, covering LEDs and liquid crystal, grew revenue 13.7% to ¥10,444 million and profit 20.8% to ¥1,322 million on higher automotive LED volumes.
A margin that went two ways at once
The gross line improved markedly: gross profit rose 41.4% to ¥33,522 million and gross margin widened 3.20 points to 22.98%, the acquired businesses evidently carrying richer product margins than the group average. But SG&A rose 64.1% to ¥24,762 million, absorbing all of that and more, so the operating margin narrowed 1.17 points to 6.01% and operating profit advanced just ¥153 million. Corporate costs not allocated to segments grew to ¥4,281 million from ¥3,813 million.
Below the operating line the acquisition shows up again in financing. Interest expense rose to ¥655 million from ¥142 million — the balance sheet gained ¥120,917 million of liabilities in three months, mainly short-term borrowings — and a ¥128 million foreign-exchange loss replaced a ¥313 million gain a year earlier. Ordinary profit consequently fell 6.6% to ¥9,552 million even as operating profit rose.
Pre-tax profit still rose 3.7% to ¥10,377 million, helped by ¥1,271 million of gains on sales of investment securities within ¥1,292 million of extraordinary income against ¥467 million of losses. What took the bottom line down was the combination of a heavier tax charge — ¥4,181 million against ¥3,217 million, an effective rate of 40.3% versus 32.1% — and non-controlling interests rising to ¥2,055 million from ¥1,634 million. Net profit attributable to owners of parent therefore fell 19.7% to ¥4,140 million.
One number cushioned the per-share arithmetic. Average shares outstanding fell 17.6% to 122,938,161 from 149,111,349, so earnings per share slipped only 2.6% to ¥33.68 from ¥34.58 despite the near-20% fall in net profit.
A balance sheet reshaped by ¥54.4 billion of goodwill
Total assets rose 15.2% to ¥932,437 million in a single quarter, up ¥123,173 million: fixed assets grew ¥75,428 million on higher intangible and tangible assets, and current assets ¥47,744 million on inventories, cash and deposits. The intangible increase is dominated by the acquisition — goodwill of ¥54,434 million arose in the Electronic Application Products segment from the Iwasaki purchase, and the company notes this is a provisional figure because the allocation of acquisition cost was not complete at quarter-end.
Liabilities rose ¥120,917 million to ¥358,242 million, chiefly short-term borrowings — the deal was debt-funded. Net assets grew only ¥2,255 million to ¥574,194 million, as a ¥2,359 million decline in shareholders' equity was more than offset by a ¥9,027 million rise in accumulated other comprehensive income from unrealised securities gains and translation adjustments. The equity ratio therefore fell 6.7 points to 49.4% from 56.1% — the clearest single measure of what the acquisition did to the balance sheet. Comprehensive income of ¥16,201 million against ¥482 million reflects those same market-driven movements. Quarterly depreciation was ¥11,179 million against ¥10,067 million, and goodwill amortisation ¥1,506 million against ¥130 million.
Guidance and dividend both held
Stanley Electric left its full-year forecast unchanged: revenue of ¥622,000 million (+20.0%), operating profit of ¥55,000 million (+28.9%), ordinary profit of ¥58,000 million (+14.1%) and net profit of ¥34,000 million (+3.6%), for earnings per share of ¥276.43. The shape of that plan is unusually back-loaded. First-half guidance calls for operating profit of just ¥17,000 million, down 7.9%, and net profit of ¥8,000 million, down 21.3% — meaning the entire 28.9% full-year operating-profit increase is expected in the second half, consistent with Iwasaki's stated seasonality.
The annual dividend is planned at ¥111.00 — ¥55.00 interim and ¥56.00 final — against ¥104.00 for FY3/2026, a 6.7% increase, with no revision to the previously announced forecast. The quarterly financial statements carried a voluntary review by the auditor.
| Metric | Q1 FY3/2027 | Q1 FY3/2026 | Change |
|---|---|---|---|
| Revenue (¥ million) | 145,856 | 119,838 | +21.7% |
| Gross profit (¥ million) | 33,522 | 23,700 | +41.4% |
| Gross margin | 22.98% | 19.78% | +3.20 pt |
| SG&A expenses (¥ million) | 24,762 | 15,092 | +64.1% |
| Operating profit (¥ million) | 8,760 | 8,607 | +1.8% |
| Operating margin | 6.01% | 7.18% | −1.17 pt |
| Ordinary profit (¥ million) | 9,552 | 10,229 | −6.6% |
| Pre-tax profit (¥ million) | 10,377 | 10,008 | +3.7% |
| Net profit attrib. to owners of parent (¥ million) | 4,140 | 5,156 | −19.7% |
| Comprehensive income (¥ million) | 16,201 | 482 | n.m. |
| EPS (¥) | 33.68 | 34.58 | −2.6% |
| Automotive Equipment — revenue (¥ million) | 111,986 | 103,059 | +8.7% |
| Automotive Equipment — segment profit (¥ million) | 10,025 | 9,425 | +6.4% |
| Components — revenue (¥ million) | 10,444 | 9,186 | +13.7% |
| Components — segment profit (¥ million) | 1,322 | 1,094 | +20.8% |
| Electronic Application Products — revenue (¥ million) | 48,407 | 27,600 | +75.4% |
| Electronic Application Products — segment profit (¥ million) | 1,268 | 2,148 | −41.0% |
| Total assets (¥ million) | 932,437 | 809,264 | +15.2% |
| Total liabilities (¥ million) | 358,242 | 237,325 | +50.9% |
| Net assets (¥ million) | 574,194 | 571,938 | +0.4% |
| Shareholders' equity (¥ million) | 460,881 | 454,213 | +1.5% |
| Equity ratio | 49.4% | 56.1% | −6.7 pt |
| FY3/2027 guidance — revenue (¥ million) | 622,000 | — | +20.0% |
| FY3/2027 guidance — operating profit (¥ million) | 55,000 | — | +28.9% |
| FY3/2027 guidance — ordinary profit (¥ million) | 58,000 | — | +14.1% |
| FY3/2027 guidance — net profit (¥ million) | 34,000 | — | +3.6% |
| FY3/2027 guidance — EPS (¥) | 276.43 | — | — |
| Annual dividend per share (¥) | 111.00 | 104.00 | +6.7% |
JapanStockPulse provides informational content only and does not constitute investment advice. Figures are taken from the company's published earnings short report and may be subject to subsequent revision.