A quarter that reset the full-year bar
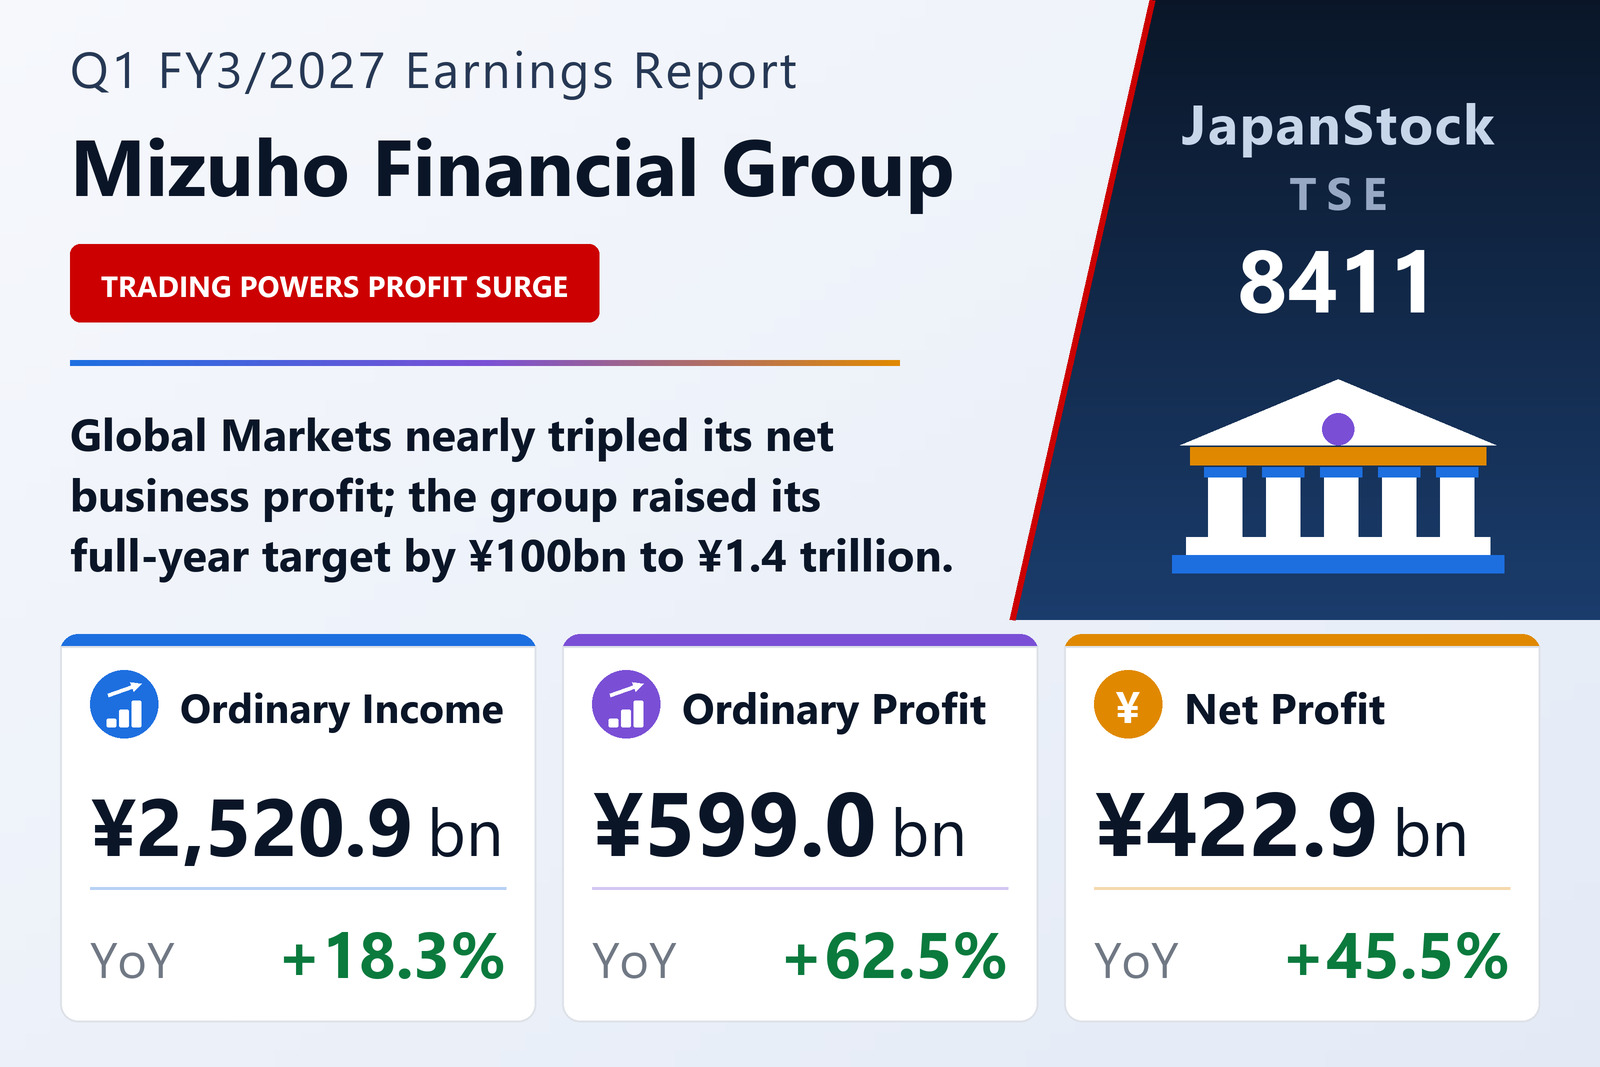
Mizuho Financial Group, Inc. (TSE: 8411) published consolidated first-quarter results for FY3/2027 on July 30, 2026, covering April 1 to June 30, 2026 under Japanese GAAP. Ordinary income rose 18.3% to ¥2,520,855 million, ordinary profit 62.5% to ¥598,973 million, and net profit attributable to owners of parent 45.5% to ¥422,909 million. Earnings per share reached ¥173.53 against ¥115.90.
The scale of the beat matters more than the percentages. A single quarter of ¥422.9 billion is 30.2% of the newly raised ¥1.4 trillion full-year target, and the previous target of ¥1.30 trillion was set only three months earlier. Mizuho lifted it by ¥100 billion, or 7.6%, in the same disclosure — an unusually large mid-year revision for a megabank, and one made after just one quarter of the year had closed.
Underneath, the revenue mix broadened rather than narrowing. Net interest income rose 20.8% to ¥364.1 billion as loan interest income climbed 13.7% to ¥735,811 million and interest and dividends on securities 29.0% to ¥262,894 million — the domestic rate cycle working through both the loan book and the investment portfolio. Net fee and commission income rose 21.3% to ¥266.4 billion, trading income 49.4% to ¥276.6 billion, and other operating income more than doubled to ¥102.7 billion from ¥42.7 billion.
Global Markets did the heavy lifting — and one segment did not
Of the ¥262.0 billion of additional consolidated gross profit, the Global Markets company (GMC) supplied ¥139.9 billion, lifting its own gross profit 80.1% to ¥314,498 million and its net business profit 171.8% to ¥199,661 million. Part of that is a one-off in character: ETF-related gains booked in the quarter came to ¥43,344 million, of which ¥42,904 million sat in GMC, against just ¥3,210 million a year earlier. Strip those out and GMC's gross profit still rose by roughly ¥100 billion, so the trading and investment book did far more than realise equity gains.
The domestic franchises delivered the cleaner operating leverage. Retail & Business Banking grew gross profit 20.7% to ¥258,494 million while its expenses rose 4.2%, and its net business profit consequently more than doubled — up 117.3% to ¥82,219 million. Corporate & Investment Banking lifted gross profit 37.1% to ¥211,216 million and net business profit 55.0% to ¥153,016 million. Asset Management was the small laggard, its gross profit down 11.2% to ¥15,501 million, though net business profit still rose 14.7%.
The exception worth naming is the overseas arm. Global Corporate & Investment Banking grew gross profit just 1.3% to ¥232,801 million while its expense line rose 12.9% to ¥143,807 million, and its net business profit therefore fell 11.7% to ¥95,481 million — the only reporting company to go backwards on the bottom line. In a quarter when every other unit expanded, GCIBC's cost growth outpaced a nearly flat revenue base. Note that Mizuho changed its expense-allocation method in April 2026 and restated the prior-year segment figures accordingly, and that overseas revenue and expenses are translated at budget rates for segment reporting.
Costs, credit and the quality of the beat
General and administrative expenses rose 9.8% to ¥505,969 million — meaningful growth, but less than a third of the pace of gross profit, which is the whole reason consolidated net business profit jumped 70.6% to ¥532.4 billion from ¥312.0 billion. Depreciation rose to ¥61,359 million from ¥50,817 million and goodwill amortisation to ¥2,907 million from ¥1,802 million.
Two items argue for reading the headline with care. Credit-related costs swung to a net charge of ¥6.1 billion from a net benefit of ¥11.4 billion a year earlier, a ¥17.6 billion adverse move: non-performing-loan disposal costs rose to ¥23,774 million from ¥17,504 million while reversals of loan-loss provisions fell to ¥17,618 million from ¥28,967 million. And while total net gains on stocks reached ¥73.9 billion against ¥39.8 billion, the ETF component accounts for all of that increase — equity-related gains excluding ETFs actually fell, to ¥30,570 million from ¥35,442 million.
Below the ordinary line the arithmetic reverses. Extraordinary items produced a net loss of ¥6,059 million against a net gain of ¥10,011 million, and the tax charge rose to ¥168,411 million from ¥86,934 million — an effective rate of 28.4% versus 23.0%. That is why net profit grew 45.5% while ordinary profit grew 62.5%.
Guidance, dividend and a shrinking share count
The revised full-year target of ¥1,400,000 million is 12.1% above FY3/2026 and implies ¥977.1 billion across the remaining three quarters — a slower run-rate than the first quarter delivered, which is consistent with treating the ETF gains and market conditions as not fully repeatable. Forecast earnings per share are ¥575.08. The annual dividend plan is unchanged at ¥150.00 (¥75.00 interim and ¥75.00 final) against ¥145.00 paid for FY3/2026.
The share count is doing quiet work alongside it. Shares issued fell to 2,442,831,994 from 2,489,848,594 — a cancellation of 47.0 million shares — and treasury holdings dropped to 9,294,931 from 51,325,298. Average shares outstanding for the quarter were 2,437.0 million against 2,506.5 million, 2.8% fewer, which is why earnings per share rose 49.7% against a 45.5% rise in net profit.
The balance sheet expanded only marginally: total assets stood at ¥304.28 trillion, up 0.7% from March 31, with deposits roughly flat at ¥165.3 trillion and net assets up 1.6% to ¥11,587,130 million. The 3.7% equity ratio disclosed in the earnings report is total net assets less non-controlling interests over total assets, and is not the regulatory capital adequacy ratio.
| Metric | Q1 FY3/2027 | Q1 FY3/2026 | Change |
|---|---|---|---|
| Ordinary income (¥ million) | 2,520,855 | 2,130,048 | +18.3% |
| Consolidated gross profit (¥ million) | 1,026,700 | 764,700 | +34.3% |
| — net interest income (¥ million) | 364,100 | 301,400 | +20.8% |
| — net fee and commission income (¥ million) | 266,400 | 219,700 | +21.3% |
| — trading income (¥ million) | 276,600 | 185,100 | +49.4% |
| General and administrative expenses (¥ million) | 505,969 | 460,705 | +9.8% |
| Consolidated net business profit (¥ million) | 532,400 | 312,000 | +70.6% |
| Ordinary profit (¥ million) | 598,973 | 368,583 | +62.5% |
| Net profit attrib. to owners of parent (¥ million) | 422,909 | 290,521 | +45.5% |
| Comprehensive income (¥ million) | 413,801 | 328,712 | +25.8% |
| EPS (¥) | 173.53 | 115.90 | +49.7% |
| Retail & Business Banking (RBC) — segment gross profit (¥ million) | 258,494 | 214,140 | +20.7% |
| Retail & Business Banking (RBC) — segment profit (¥ million) | 82,219 | 37,833 | +117.3% |
| Corporate & Investment Banking (CIBC) — segment gross profit (¥ million) | 211,216 | 154,106 | +37.1% |
| Corporate & Investment Banking (CIBC) — segment profit (¥ million) | 153,016 | 98,744 | +55.0% |
| Global Corporate & Investment Banking (GCIBC) — segment gross profit (¥ million) | 232,801 | 229,770 | +1.3% |
| Global Corporate & Investment Banking (GCIBC) — segment profit (¥ million) | 95,481 | 108,092 | −11.7% |
| Global Markets (GMC) — segment gross profit (¥ million) | 314,498 | 174,619 | +80.1% |
| Global Markets (GMC) — segment profit (¥ million) | 199,661 | 73,458 | +171.8% |
| Asset Management (AMC) — segment gross profit (¥ million) | 15,501 | 17,465 | −11.2% |
| Asset Management (AMC) — segment profit (¥ million) | 5,132 | 4,473 | +14.7% |
| Total assets (¥ million) | 304,283,463 | 302,240,042 | +0.7% |
| Net assets (¥ million) | 11,587,130 | 11,403,890 | +1.6% |
| Equity ratio | 3.7% | 3.7% | unchanged |
| FY3/2027 guidance — net profit (¥ million) | 1,400,000 | — | +12.1% |
| FY3/2027 guidance — EPS (¥) | 575.08 | — | — |
| Annual dividend per share (¥) | 150.00 | 145.00 | +3.4% |
JapanStockPulse provides informational content only and does not constitute investment advice. Figures are taken from the company's published earnings short report and may be subject to subsequent revision.