The advertising quarter that went wrong
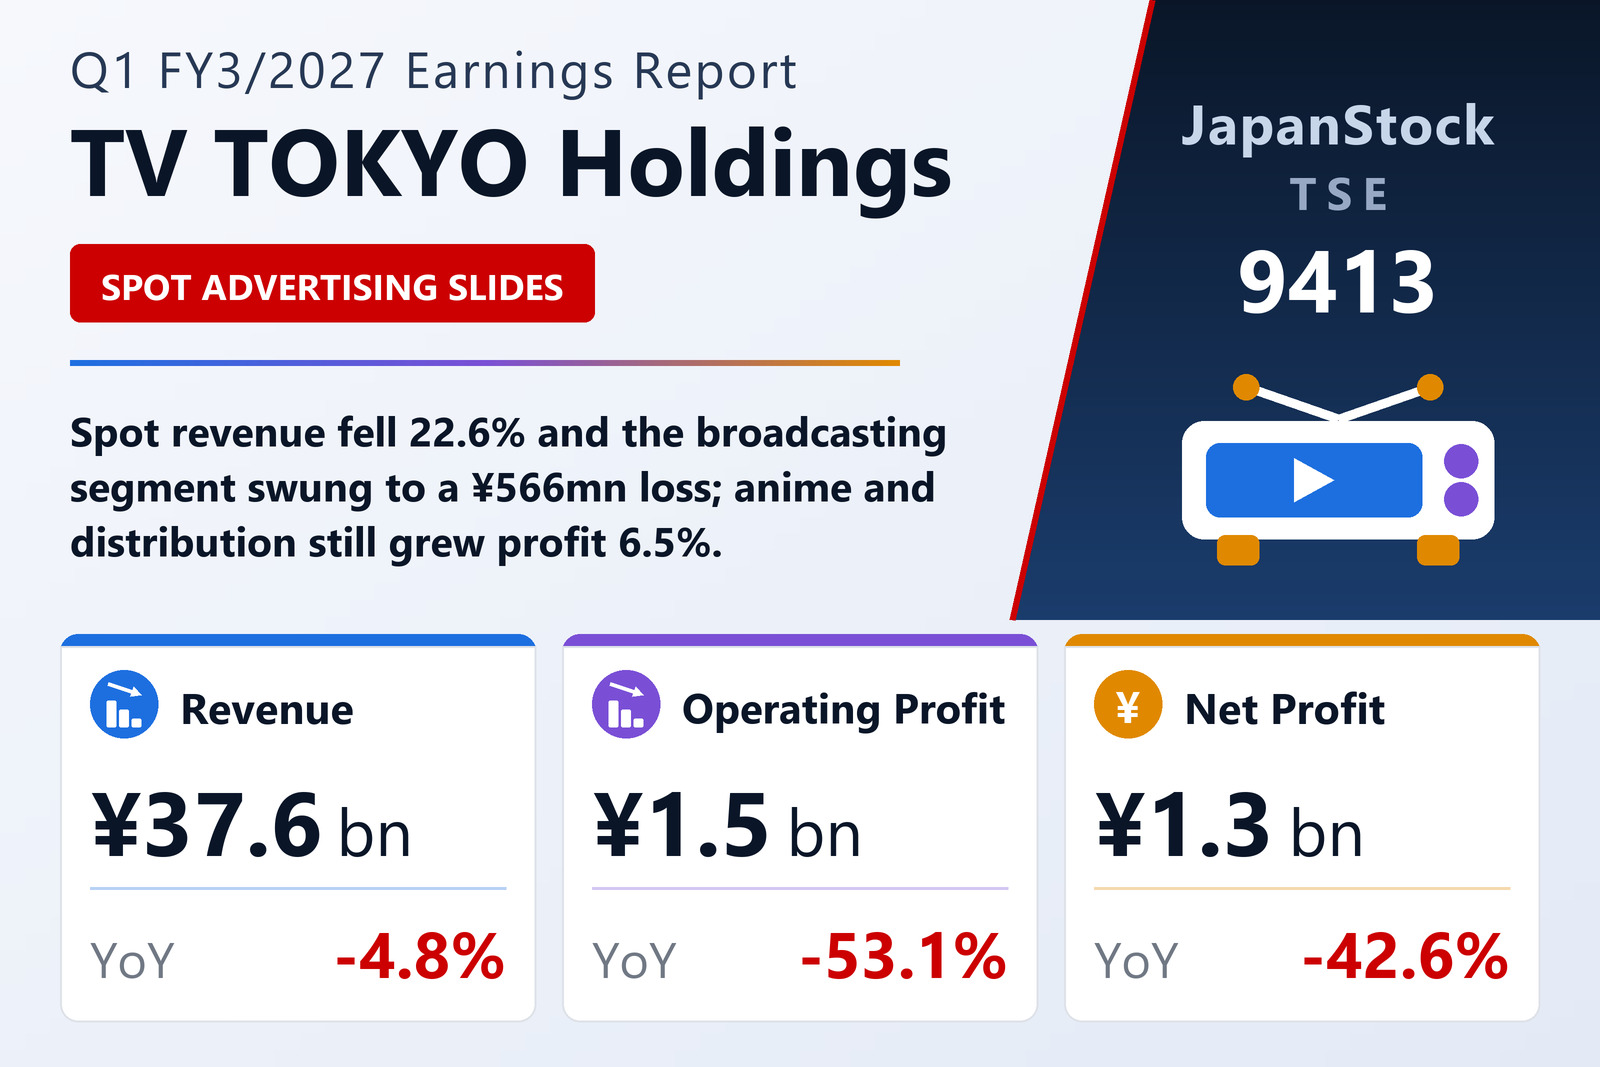
TV TOKYO Holdings Corporation (TSE: 9413) published consolidated first-quarter results for FY3/2027 on July 30, 2026, covering April 1 to June 30, 2026 under Japanese GAAP. Revenue fell 4.8% to ¥37,625 million and operating profit 53.1% to ¥1,535 million — a decline made steeper by the base: a year earlier, operating profit had risen 186.3%. Ordinary profit fell 44.7% to ¥1,906 million and net profit attributable to owners of parent 42.6% to ¥1,343 million, for earnings per share of ¥50.46 against ¥87.99.
Operating expenses barely moved, falling just 0.5% to ¥36,089 million against a 4.8% revenue decline. That is the whole arithmetic of the quarter: a ¥1,911 million fall in revenue met only ¥176 million of cost relief, so ¥1,736 million of it landed on operating profit. The operating margin narrowed 4.19 points to 4.08%.
Almost all of the revenue loss sits at the core broadcaster. At TV TOKYO Corporation, the group's principal subsidiary, revenue fell 6.3% to ¥28,223 million and operating profit 65.4% to ¥940 million. Within its broadcasting business, revenue fell 10.9% to ¥17,939 million: spot advertising — the volatile, market-priced half — collapsed 22.6% to ¥5,960 million, with beverages, transport and leisure, and distribution and retail all weak, offsetting strength in real estate and housing equipment, energy and materials, and hobbies and sport. Time revenue from programme sponsors, the contracted half, fell a much gentler 3.5% to ¥10,504 million, with national network sales soft on global conditions and the Tokyo-area local segment hurt by programming changes; special programming set a record with World Table Tennis 2026 but weekend-evening specials undershot plan. Programme sales to regional stations fell 3.0% to ¥1,034 million.
Broadcasting costs would not follow. Total broadcasting expenses fell only 2.3% to ¥14,976 million, and within them content production costs actually rose 3.4% to ¥8,494 million — the company kept spending on programmes while the advertising market repriced. Broadcasting business profit consequently fell 38.5% to ¥2,963 million.
The segment split: one loss, two gains
Terrestrial & BS Broadcasting swung to an operating loss of ¥566 million from a ¥1,356 million profit, on revenue down 7.3% to ¥22,671 million. That single ¥1,922 million reversal is larger than the ¥1,736 million decline in group operating profit — meaning the rest of the group was, on balance, still improving. One bright spot sits inside it: BS TV TOKYO grew operating profit 27.8% to ¥533 million on revenue of ¥3,665 million (down just 0.2%), as news and special-programme sponsorship sales outran a weaker spot market, and programme production and technical costs fell 3.8%.
Anime & Distribution grew revenue 1.6% to ¥12,552 million and segment profit 6.5% to ¥2,192 million. Underneath, the mix rotated. TV TOKYO's rights business revenue rose 3.7% to ¥10,184 million and its profit 6.2% to ¥4,601 million, but the anime division itself fell 2.8% to ¥6,531 million — BORUTO SNS-game deployment and video sales in China, NARUTO video sales and game licensing, and Yu-Gi-Oh merchandising all performed well, but could not fully offset the reaction to a prior-year theatrical anime release. The distribution business rose 13.1% to ¥3,206 million: advertising-funded free video revenue was weak on market conditions, but sales of domestic and Asian rights to The Flowers of Evil, new dramas, archive titles such as the Solitary Gourmet series, and paid subscriptions at TV TOKYO BIZ more than made up for it. Events, a small line, grew 70.9% to ¥446 million on an active slate of ticketed shows. Elsewhere in the segment, TV TOKYO Music grew 11.6% to ¥1,085 million on royalties, while AT-X fell 5.4% to ¥790 million on subscriber decline and the absence of a prior-year theatrical box-office contribution.
Shopping & Other grew revenue 4.5% to ¥4,531 million and profit 48.4% to ¥183 million — the fastest profit growth in the group, albeit from the smallest base. TV TOKYO Direct rose 5.4% to ¥2,832 million as reform and cooling products and food lines held up against weak general merchandise, and character goods sold well.
Balance sheet and an unchanged plan
Current assets fell ¥5,103 million to ¥93,212 million, mostly on ¥3,322 million less cash and ¥2,144 million less receivables; fixed assets fell ¥1,508 million to ¥55,958 million. Current liabilities fell ¥5,131 million to ¥39,842 million on lower accrued expenses, bonus provisions and income taxes payable. Net assets fell ¥1,646 million to ¥105,908 million, with capital surplus, retained earnings and unrealised securities gains all lower. Because assets shrank faster than equity, the equity ratio actually improved 2.1 points to 71.0%.
Management left the May 8, 2026 full-year forecast unchanged: revenue of ¥168,000 million (+1.9%), operating profit of ¥11,500 million (+0.9%), ordinary profit of ¥11,800 million (−1.2%) and net profit of ¥8,000 million (+3.9%), for earnings per share of ¥300.55. That is a demanding hold — the first quarter delivered only 13.3% of the full-year operating-profit target, against 22.4% at the same point last year, so the remaining three quarters must produce ¥9,965 million where the prior year's equivalent produced ¥8,133 million.
Strategically the group says it is pushing further into anime, business news and original intellectual property, taking that IP international — accelerating anime distribution and merchandising in China and now Southeast Asia, Europe, the United States and the Middle East — while developing new businesses alongside growth investment. The annual dividend plan is unchanged at ¥100.00, though its shape changes: ¥50.00 interim and ¥50.00 final, against ¥15.00 and ¥85.00 for FY3/2026.
| Metric | Q1 FY3/2027 | Q1 FY3/2026 | Change |
|---|---|---|---|
| Revenue (¥ million) | 37,625 | 39,536 | −4.8% |
| Operating expenses (¥ million) | 36,089 | 36,265 | −0.5% |
| Operating profit (¥ million) | 1,535 | 3,271 | −53.1% |
| Operating margin | 4.08% | 8.27% | −4.19 pt |
| Ordinary profit (¥ million) | 1,906 | 3,448 | −44.7% |
| Net profit attrib. to owners of parent (¥ million) | 1,343 | 2,341 | −42.6% |
| Comprehensive income (¥ million) | 972 | 3,330 | −70.8% |
| EPS (¥) | 50.46 | 87.99 | −42.7% |
| Terrestrial & BS Broadcasting — revenue (¥ million) | 22,671 | 24,444 | −7.3% |
| Terrestrial & BS Broadcasting — segment profit (¥ million) | −566 | 1,356 | profit to loss |
| Anime & Distribution — revenue (¥ million) | 12,552 | 12,352 | +1.6% |
| Anime & Distribution — segment profit (¥ million) | 2,192 | 2,058 | +6.5% |
| Shopping & Other — revenue (¥ million) | 4,531 | 4,336 | +4.5% |
| Shopping & Other — segment profit (¥ million) | 183 | 124 | +48.4% |
| TV TOKYO spot advertising revenue (¥ million) | 5,960 | 7,696 | −22.6% |
| TV TOKYO time advertising revenue (¥ million) | 10,504 | 10,881 | −3.5% |
| TV TOKYO rights business profit (¥ million) | 4,601 | 4,331 | +6.2% |
| Total assets (¥ million) | 149,170 | 155,783 | −4.2% |
| Net assets (¥ million) | 105,908 | 107,554 | −1.5% |
| Shareholders' equity (¥ million) | 105,908 | 107,412 | −1.4% |
| Equity ratio | 71.0% | 68.9% | +2.1 pt |
| FY3/2027 guidance — revenue (¥ million) | 168,000 | — | +1.9% |
| FY3/2027 guidance — operating profit (¥ million) | 11,500 | — | +0.9% |
| FY3/2027 guidance — ordinary profit (¥ million) | 11,800 | — | −1.2% |
| FY3/2027 guidance — net profit (¥ million) | 8,000 | — | +3.9% |
| FY3/2027 guidance — EPS (¥) | 300.55 | — | — |
| Annual dividend per share (¥) | 100.00 | 100.00 | unchanged |
JapanStockPulse provides informational content only and does not constitute investment advice. Figures are taken from the company's published earnings short report and may be subject to subsequent revision.