The headline GMV decline is a reporting artefact
ZOZO, Inc. (TSE: 3092) published consolidated first-quarter results for FY3/2027 on July 31, 2026, covering April 1 to June 30, 2026 under Japanese GAAP. The first number a reader meets looks bad and is not: merchandise transaction value fell 1.6% to ¥156,750 million. Excluding the 'other' category it rose 5.1% to ¥156,694 million.
The gap is entirely mechanical. From the end of September 2025 ZOZO stopped recording the merchandise value of ZOZO-option contracted stores on Yahoo! Shopping in the 'other' line. That line accordingly collapsed from ¥10,162 million to ¥56 million, down 99.4%, while its associated revenue was near-flat at ¥6,921 million, up 1.1%. Every operating comparison in the filing is made against the ex-other figure, and so is this article.
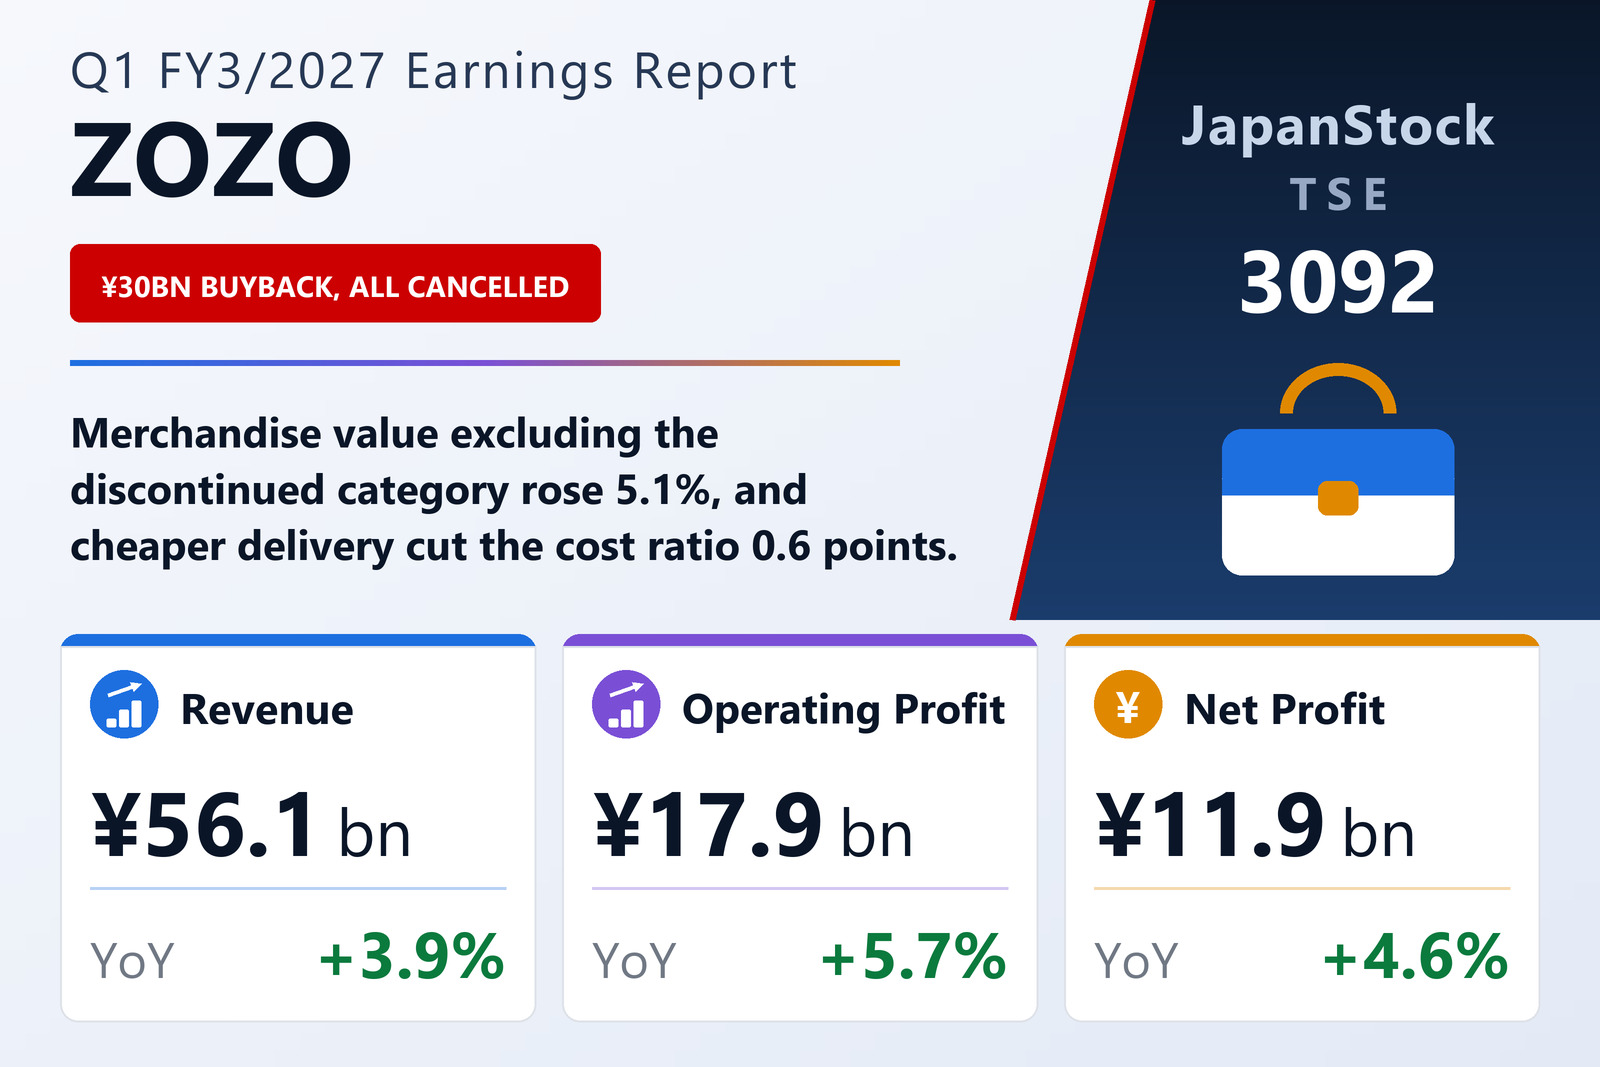
On that basis the quarter was one of steady growth with a small margin give-back. Revenue rose 3.9% to ¥56,132 million and gross profit 3.4% to ¥52,471 million, but gross profit measured against merchandise value ex-other — the take rate — slipped to 33.5% from 34.0%. ZOZO gives two reasons: LYST, consolidated for one month longer than in the prior-year quarter, earns a performance-based commission at a lower rate on merchandise value than consignment sales or LINE Yahoo Commerce, so its growth dilutes the blended rate; and ZOZOTOWN itself stepped up discounts and point campaigns, which are deducted from revenue.
Costs did the work the take rate did not
Selling, general and administrative expenses rose only 2.2% to ¥34,587 million, well below both revenue and merchandise-value growth, so the SG&A ratio against merchandise value ex-other fell 0.6 points to 22.1%. That improvement is the reason operating profit outgrew revenue.
The composition is unusually well disclosed. On the improving side, packing and shipping costs fell 0.6 points as a share of merchandise value, following improved economic terms agreed with delivery contractors from October 2025 after a delivery-efficiency programme; logistics-related costs fell 0.3 points on better warehouse productivity; and other expenses fell 0.3 points against a prior-year quarter that carried one-off costs from the LYST acquisition. Working the other way, depreciation rose 0.2 points as materials-handling equipment installed at existing logistics centres began to be depreciated, and goodwill amortisation rose 0.2 points on LYST's longer consolidation period plus the new consolidation of High Link.
The result: operating profit of ¥17,883 million, up 5.7%, with the operating margin on merchandise value at 11.4% against 11.3%. Adjusted EBITA — operating profit plus goodwill and PPA-related amortisation plus M&A costs, the metric ZOZO manages to — rose 3.6% to ¥18,746 million, a margin of 12.0% against 12.1%. That adjusted line grew more slowly than reported operating profit precisely because the amortisation it adds back grew; on the company's preferred measure, profitability was flat rather than up.
Below that, ordinary profit rose 7.4% to ¥17,866 million — faster than operating profit — and net profit attributable to owners of parent 4.6% to ¥11,895 million, with EPS of ¥13.45 against ¥12.79. Comprehensive income was ¥12,333 million, essentially unchanged from ¥12,332 million.
LYST is the growth engine; ZOZOTOWN is the base
ZOZOTOWN remains the core, with merchandise value of ¥126,010 million, up 3.6%, and revenue of ¥38,702 million, up 3.2%. Inside it, consignment sales — brands' inventory held and sold on their behalf — grew 3.6% to ¥120,384 million; USED sales grew 10.0% to ¥5,059 million; and purchase-and-manufacture sales, the inventory-risk model that the company ended in the prior fiscal year, shrank 32.1% to ¥566 million as expected.
LYST, the global discovery platform ZOZO positions as the core of its Global domain, is the fastest-growing line by a wide margin: merchandise value up 33.3% to ¥10,083 million and revenue up 36.4% to ¥1,388 million. LINE Yahoo Commerce — the combined Yahoo! Shopping and Yahoo! Auctions figure — grew merchandise value 7.6% to ¥18,952 million and revenue 8.9% to ¥5,877 million, helped by customer retention and campaigns including three 'Honki no ZOZO Matsuri' event days in April, May and June. BtoB shrank, down 27.1% to ¥1,647 million of merchandise value, and advertising revenue grew 2.4% to ¥2,976 million.
The customer numbers are the most reassuring part of the disclosure. Annual buyers reached 13,415,786, an increase of 1,050,706 year on year and 242,341 on the previous quarter, and active members 12,716,094. ZOZOTOWN ended the quarter with 1,714 shops — 29 opened for a net gain of four, including TOKYO BASE's new select-shop format KEY TIMEZ, the Japan national football team's official JFA STORE, and womenswear brand polaura — and 11,548 brands.
Two strategic moves sit behind the quarter. In April 2026 ZOZO published a medium-term plan targeting adjusted EBITA of ¥90 billion in FY3/2030, built on three domains — More Fashion, Near Fashion and Global. Also in April it took 100% of High Link, operator of the fragrance platform Coloria, consolidating it from May 2026 as the anchor of the Near Fashion domain. And on April 27 it opened a LINE official account, 'ZOZO no Niau Code AI Rabo-kun', which uses the company's accumulated fashion data to suggest coordinated outfits — an attempt to reach shoppers earlier in the decision process and to open LINE as a new traffic source into ZOZOTOWN.
A ¥30 billion buyback, to be cancelled in full
The board resolved on June 16, 2026 to acquire and then cancel treasury shares. The authorisation covers up to 43,000,000 shares — 4.86% of shares outstanding excluding treasury — for up to ¥30,000 million, by market purchase on the Tokyo Stock Exchange between June 17 and December 30, 2026. Every share acquired is scheduled to be cancelled on January 29, 2027.
By the end of the quarter ZOZO had already bought 2,528,300 shares for ¥2,841 million, or 9.5% of the yen authorisation in the first two weeks of the window. The stated rationale is the shareholder-return policy announced on October 31, 2023: a total return ratio averaging above 80% over the five years from FY3/2024, with buybacks included. Cancelling the whole amount rather than holding it in treasury means the share count falls permanently, which matters for a company guiding EPS of ¥56.20.
That programme also explains most of the balance-sheet movement. Total assets fell 9.8% to ¥178,869 million and net assets 7.7% to ¥98,610 million over the three months — the combined effect of the buyback, the year-end dividend and tax payments against a quarter's earnings. The equity ratio nonetheless rose to 55.1% from 53.9%, because assets fell faster than equity.
Guidance unchanged, and the quarter is on it
ZOZO left its FY3/2027 forecast unchanged: revenue of ¥241,900 million, up 5.9%, operating profit of ¥74,400 million, up 7.3%, adjusted EBITA of ¥77,900 million, up 7.2%, ordinary profit of ¥74,400 million, up 7.4%, and net profit of ¥49,700 million, up 3.7%, for EPS of ¥56.20.
The quarter tracks that plan closely: 23.2% of guided revenue, 24.0% of guided operating profit, 24.1% of guided adjusted EBITA and 23.9% of guided net profit. All four sit at or just above a straight-line quarter, which for a business whose fourth quarter carries the winter season is a comfortable place to start. The revenue line is the one running slightly light — 3.9% growth against a 5.9% full-year target — and the swing factor there is whether the take-rate dilution from LYST's mix and from ZOZOTOWN's discounting persists at this level.
The dividend is guided at ¥40.00 per share for FY3/2027 — ¥20.00 at the interim and ¥20.00 at the year-end — against ¥39.00 paid in FY3/2026, unchanged from the previous announcement. On guided EPS of ¥56.20 that is a payout ratio of about 71%, before the buyback; taken together with the ¥30 billion authorisation, the total return is the number the company is actually managing to.
On the environment, ZOZO describes a domestic fashion market that held firm on improving employment and incomes but remains clouded by persistent inflation, climate variability and geopolitical risk. Its response is the three-domain plan: deepen ZOZOTOWN's unique-user count and conversion rate in More Fashion, build out Near Fashion through Coloria, and pursue discontinuous growth in global markets through LYST.
| Metric | Q1 FY3/2027 | Q1 FY3/2026 | Change |
|---|---|---|---|
| Merchandise transaction value (¥ million) | 156,750 | 159,263 | −1.6% |
| — excluding other merchandise (¥ million) | 156,694 | 149,100 | +5.1% |
| Revenue (¥ million) | 56,132 | 54,028 | +3.9% |
| Gross profit (¥ million) | 52,471 | 50,765 | +3.4% |
| SG&A expenses (¥ million) | 34,587 | — | +2.2% |
| Operating profit (¥ million) | 17,883 | 16,920 | +5.7% |
| Adjusted EBITA (¥ million) | 18,746 | 18,093 | +3.6% |
| Adjusted EBITA margin on merchandise value | 12.0% | 12.1% | −0.1 pt |
| Ordinary profit (¥ million) | 17,866 | 16,638 | +7.4% |
| Net profit attrib. to owners of parent (¥ million) | 11,895 | 11,376 | +4.6% |
| Comprehensive income (¥ million) | 12,333 | 12,332 | +0.0% |
| EPS (¥) | 13.45 | 12.79 | +5.2% |
| ZOZOTOWN — merchandise transaction value (¥ million) | 126,010 | 121,670 | +3.6% |
| ZOZOTOWN — revenue (¥ million) | 38,702 | 37,485 | +3.2% |
| — consignment sales, merchandise value (¥ million) | 120,384 | 116,237 | +3.6% |
| — USED sales, merchandise value (¥ million) | 5,059 | 4,598 | +10.0% |
| LINE Yahoo Commerce — merchandise transaction value (¥ million) | 18,952 | 17,606 | +7.6% |
| LINE Yahoo Commerce — revenue (¥ million) | 5,877 | 5,398 | +8.9% |
| LYST — merchandise transaction value (¥ million) | 10,083 | 7,562 | +33.3% |
| LYST — revenue (¥ million) | 1,388 | 1,017 | +36.4% |
| BtoB — merchandise transaction value (¥ million) | 1,647 | 2,260 | −27.1% |
| BtoB — revenue (¥ million) | 266 | 373 | −28.8% |
| Advertising — revenue (¥ million) | 2,976 | 2,907 | +2.4% |
| Annual buyers (people) | 13,415,786 | 12,365,080 | +8.5% |
| Active members (people) | 12,716,094 | 11,587,777 | +9.7% |
| ZOZOTOWN shops at period end | 1,714 | 1,681 | +2.0% |
| Brands at period end | 11,548 | 9,208 | +25.4% |
| Total assets (¥ million) | 178,869 | 198,260 | −9.8% |
| Net assets (¥ million) | 98,610 | 106,789 | −7.7% |
| Equity ratio | 55.1% | 53.9% | +1.2 pt |
| FY3/2027 guidance — revenue (¥ million) | 241,900 | — | +5.9% |
| FY3/2027 guidance — operating profit (¥ million) | 74,400 | — | +7.3% |
| FY3/2027 guidance — adjusted EBITA (¥ million) | 77,900 | — | +7.2% |
| FY3/2027 guidance — ordinary profit (¥ million) | 74,400 | — | +7.4% |
| FY3/2027 guidance — net profit (¥ million) | 49,700 | — | +3.7% |
| FY3/2027 guidance — EPS (¥) | 56.20 | — | — |
| Annual dividend per share (¥) | 40.00 | 39.00 | +2.6% |
JapanStockPulse provides informational content only and does not constitute investment advice. Figures are taken from the company's published earnings short report and may be subject to subsequent revision.