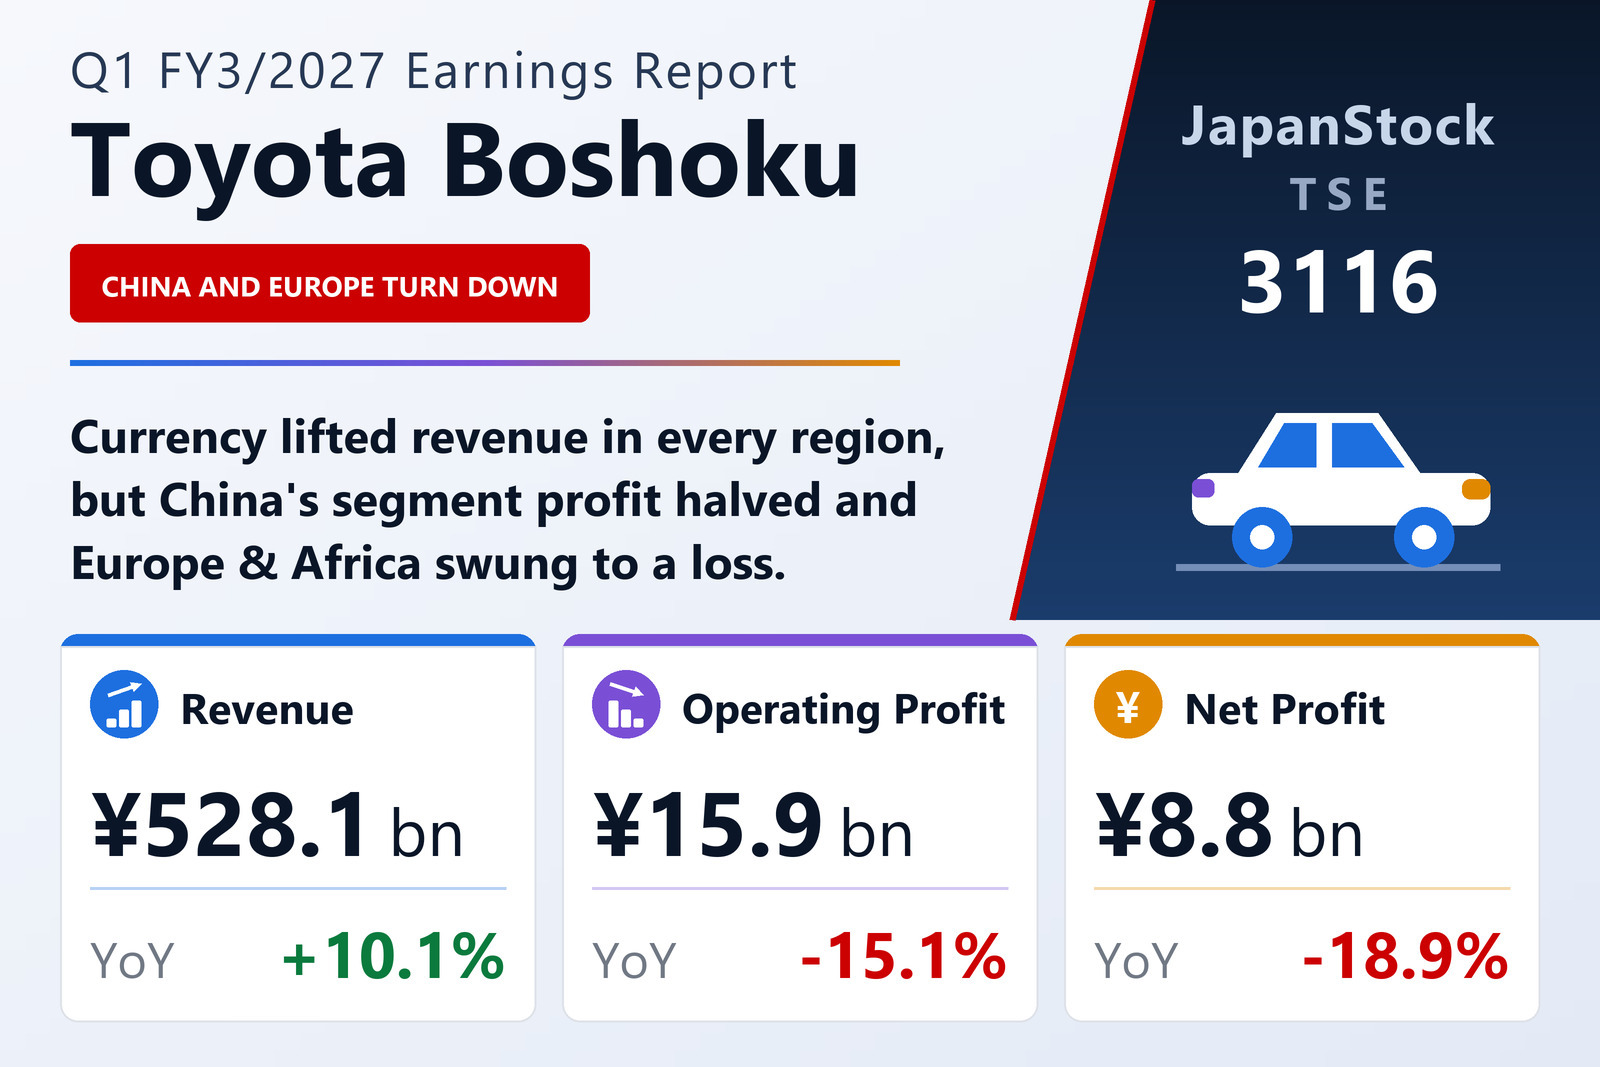
Revenue and profit moved in opposite directions
Toyota Boshoku Corporation (TSE: 3116) — the Aichi-based supplier of seats, interior systems, filters and powertrain components, and the Toyota group's principal interior maker — published consolidated first-quarter results for FY3/2027 on July 31, 2026, covering April 1 to June 30, 2026 under IFRS. Revenue rose 10.1% to ¥528,077 million, an increase of ¥48.4 billion. Operating profit fell 15.1% to ¥15,882 million, a decrease of ¥2.8 billion. The operating margin narrowed to 3.01% from 3.90%.
The company's own summary of the gap is compact: production increases in Japan and currency effects lifted revenue despite lower volumes in China, while on the profit side new-product effects and currency were outweighed by production cuts in China, market conditions arising from the Middle East situation, and higher general expenses. Nothing in the disclosure quantifies those three separately, which is the main analytical gap in the filing.
Below the operating line the picture is better than above it. Finance costs collapsed 75.9% to ¥530 million from ¥2,200 million, while finance income was near-flat at ¥1,824 million and the equity-method share steady at ¥496 million. That ¥1.7 billion reduction in financing cost is why pre-tax profit fell only 6.5% to ¥17,672 million against operating profit's 15.1%. It did not carry all the way down: profit for the period fell 23.4% to ¥10,070 million — a steeper decline than pre-tax profit, implying a higher effective tax rate — and profit attributable to owners of parent fell 18.9% to ¥8,757 million, with ¥1,313 million going to non-controlling interests against ¥2,340 million a year earlier. Basic EPS was ¥49.03 against ¥60.48.
One line rose sharply and is not operational: comprehensive income of ¥14,781 million, up 58.5% from ¥9,324 million, driven by foreign-currency translation of overseas operations. The company explicitly attributes the quarter's ¥0.7 billion increase in equity to exactly that.
Every region grew revenue; only Asia and Japan grew profit
All five reporting segments increased revenue, and three of five cut profit. Asia is the group's profit centre and the most stable of the five: revenue up 11.4% to ¥78,006 million on higher output and currency, with segment profit up 0.7% to ¥9,129 million as new-model launches and currency offset model-mix changes and higher expenses. At ¥9,129 million Asia alone accounts for 57% of the ¥15,927 million of combined segment profit, on 14% of segment revenue — a margin of 11.70%, more than three times the group's.
Japan is the improvement story. Revenue rose 6.6% to ¥238,555 million on higher production volumes, and segment profit rose ¥2.9 billion to ¥2,917 million from a bare ¥5 million — essentially break-even a year ago — as new-product effects and volume outweighed the Middle East-driven market conditions and model-mix changes. Even so, at 1.22% Japan's margin remains the second-lowest in the group; the largest segment by revenue is close to the least profitable.
The three that went backwards each did so for a different reason. The Americas grew revenue fastest of all, up 16.3% to ¥157,208 million on volume and currency, but segment profit fell 43.9% to ¥2,589 million — rationalisation and higher volume were outweighed by model-mix changes — taking the margin to 1.65% from 3.41%. China grew revenue 11.8% to ¥53,969 million on currency despite falling production, and segment profit fell 50.4% to ¥2,059 million on the production cuts and higher expenses, a margin of 3.81% against 8.61%. Europe & Africa, the smallest segment, grew revenue 14.2% to ¥31,079 million on currency but swung to a segment loss of ¥768 million from an ¥855 million profit, on market conditions and model mix.
Read together, the segment table describes a supplier whose top line is being flattered by the yen while its unit economics are being squeezed by where the cars are actually built. Revenue growth of 10.1% with a margin down 0.89 points is the arithmetic of translation gains meeting volume and mix losses.
A balance sheet that barely moved
Total assets fell 0.9% to ¥1,171,914 million, a decline of ¥10.4 billion the company attributes chiefly to lower trade and other receivables. Total liabilities fell ¥11.2 billion to about ¥642.1 billion, mainly on lower bonds and borrowings — consistent with the sharp drop in finance costs noted above. Total equity rose ¥0.7 billion to ¥529,801 million, the increase coming from the currency translation of foreign operations rather than from retained earnings.
Equity attributable to owners of parent rose 1.4% to ¥492,033 million and the ratio of equity attributable to owners of parent improved to 42.0% from 41.0%. For a tier-one supplier carrying ¥642 billion of liabilities against ¥1.17 trillion of assets, that is a modest but real strengthening, and it came without help from the profit line.
Guidance revised — and it demands a very different rest of the year
Toyota Boshoku changed its full-year forecast from the figures published on April 28, 2026, citing first-quarter performance and, specifically, sales trends in China from the second quarter onwards. The revised FY3/2027 plan is revenue of ¥2,100,000 million, up 3.1%, operating profit of ¥76,000 million, up 40.9%, pre-tax profit of ¥80,000 million, up 29.2%, and profit attributable to owners of parent of ¥46,000 million, up 97.7%, for EPS of ¥257.57. The previous figures are not restated in this document, so the direction and size of the revision cannot be read from the tanshin alone.
What can be read is how much the plan now requires. The first quarter delivered 25.1% of guided revenue but only 20.9% of guided operating profit and 19.0% of guided net profit. Put in absolute terms: the plan implies ¥60.1 billion of operating profit across the remaining nine months against ¥15.9 billion booked in the first — and the prior year's corresponding nine months produced roughly ¥35.2 billion. On the bottom line the gap is starker still: ¥37.2 billion of attributable profit is required over nine months against roughly ¥12.5 billion a year earlier. Guidance of +40.9% at the operating line and +97.7% at the net line against a first quarter that fell 15.1% and 18.9% is a plan that depends heavily on the second half, and on China stabilising.
The plan is built on assumed rates of ¥150 to the US dollar, ¥180 to the euro, ¥4.7 to the Thai baht and ¥21.7 to the Chinese yuan. Given that currency is doing much of the work on the revenue line this quarter, those assumptions are load-bearing for the guidance in a way the operating narrative does not fully spell out.
The dividend is held. FY3/2026 paid ¥86.00 per share — ¥43.00 at the interim and ¥43.00 at the year-end — and FY3/2027 is guided at the same ¥43.00 and ¥43.00 for an unchanged ¥86.00, with no revision from the previously published forecast. On guided EPS of ¥257.57 that is a payout ratio of about 33%; measured against the ¥49.03 actually earned in the quarter, the dividend is the company expressing confidence in the rest of the year.
| Metric | Q1 FY3/2027 | Q1 FY3/2026 | Change |
|---|---|---|---|
| Revenue (¥ million) | 528,077 | 479,693 | +10.1% |
| Operating profit (¥ million) | 15,882 | 18,703 | −15.1% |
| Operating margin | 3.01% | 3.90% | −0.89 pt |
| Pre-tax profit (¥ million) | 17,672 | 18,901 | −6.5% |
| Profit for the period (¥ million) | 10,070 | 13,141 | −23.4% |
| Net profit attrib. to owners of parent (¥ million) | 8,757 | 10,801 | −18.9% |
| Comprehensive income (¥ million) | 14,781 | 9,324 | +58.5% |
| EPS (¥) | 49.03 | 60.48 | −18.9% |
| Japan — revenue (¥ million) | 238,555 | 223,865 | +6.6% |
| Japan — segment profit (¥ million) | 2,917 | 5 | n.m. |
| Americas — revenue (¥ million) | 157,208 | 135,171 | +16.3% |
| Americas — segment profit (¥ million) | 2,589 | 4,612 | −43.9% |
| China — revenue (¥ million) | 53,969 | 48,269 | +11.8% |
| China — segment profit (¥ million) | 2,059 | 4,154 | −50.4% |
| Asia — revenue (¥ million) | 78,006 | 70,020 | +11.4% |
| Asia — segment profit (¥ million) | 9,129 | 9,069 | +0.7% |
| Europe & Africa — revenue (¥ million) | 31,079 | 27,205 | +14.2% |
| Europe & Africa — segment profit (¥ million) | −768 | 855 | profit to loss |
| Finance income (¥ million) | 1,824 | 1,894 | −3.7% |
| Finance costs (¥ million) | 530 | 2,200 | −75.9% |
| Share of profit of equity-method investees (¥ million) | 496 | 503 | −1.4% |
| Total assets (¥ million) | 1,171,914 | 1,182,385 | −0.9% |
| Total liabilities (¥ million) | 642,113 | 653,317 | −1.7% |
| Total equity (¥ million) | 529,801 | 529,068 | +0.1% |
| Equity attrib. to owners of parent (¥ million) | 492,033 | 485,256 | +1.4% |
| Equity ratio | 42.0% | 41.0% | +1.0 pt |
| FY3/2027 guidance — revenue (¥ million) | 2,100,000 | — | +3.1% |
| FY3/2027 guidance — operating profit (¥ million) | 76,000 | — | +40.9% |
| FY3/2027 guidance — pre-tax profit (¥ million) | 80,000 | — | +29.2% |
| FY3/2027 guidance — net profit (¥ million) | 46,000 | — | +97.7% |
| FY3/2027 guidance — EPS (¥) | 257.57 | — | — |
| Annual dividend per share (¥) | 86.00 | 86.00 | unchanged |
JapanStockPulse provides informational content only and does not constitute investment advice. Figures are taken from the company's published earnings short report and may be subject to subsequent revision.