A very strong quarter, with two accounting items running in opposite directions
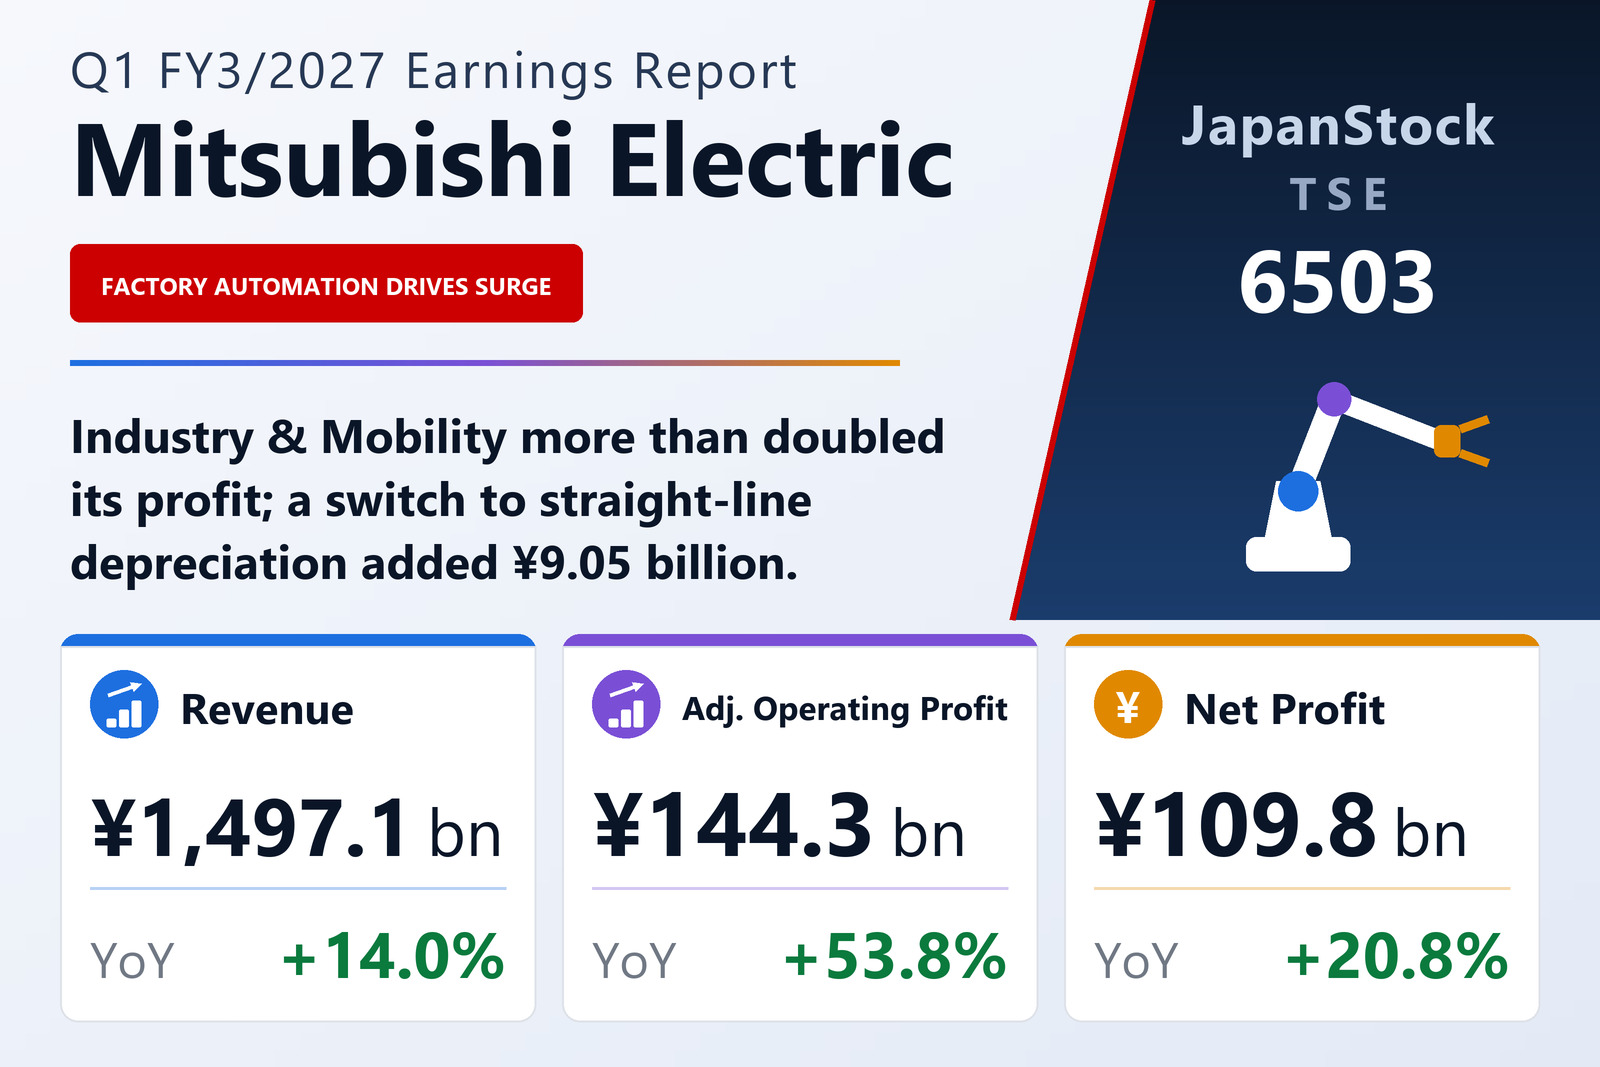
Mitsubishi Electric Corporation (TSE: 6503) published consolidated first-quarter results for FY3/2027 on July 31, 2026, covering April 1 to June 30, 2026 under IFRS. Revenue rose 14.0% to ¥1,497,109 million. Adjusted operating profit rose 53.8% to ¥144,318 million, an adjusted margin of 9.64% against 7.15%. Reported operating profit rose 24.6% to ¥139,501 million, pre-tax profit 26.6% to ¥157,077 million and net profit attributable to shareholders 20.8% to ¥109,817 million, for EPS of ¥53.66 against ¥43.89.
Two disclosures have to be read alongside those numbers, and they nearly cancel each other. The first is an accounting change. From this quarter Mitsubishi Electric switched the depreciation method for property, plant and equipment from the declining-balance method to the straight-line method. The effect is quantified: cost of sales fell ¥6,670 million and selling, general and administrative expenses ¥2,380 million against the former method, so operating profit and pre-tax profit were each ¥9,050 million higher than they would otherwise have been. That is 33% of the ¥27,529 million increase in reported operating profit, and 18% of the ¥50,467 million increase in adjusted operating profit.
The company's stated reason is strategic rather than presentational: under the new medium-term strategy beginning in FY3/2027 the group is moving from a phase of structural reform to one of business-model transformation, scaling up components and maintenance-and-service revenue to secure stable earnings, staying connected to customers to keep acquiring data, and strengthening what it calls circular digital engineering by combining decades of on-site knowledge with AI, using its Serendie platform. Because that mix implies more stable price levels and steadier asset utilisation, management judged that spreading cost evenly over an asset's useful life better reflects economic reality. The reasoning is coherent; the ¥9,050 million is nonetheless a step change in reported profit that will not repeat as growth next year.
The second item runs the other way. Between adjusted operating profit and reported operating profit sit three reconciling lines: a ¥2,514 million gain on sales of businesses and assets (against ¥15,764 million a year earlier), a ¥9,904 million special retirement expense — lump-sum payments and outplacement services under a special measure of the group's Next Stage Support Program — and ¥2,573 million of other items. Read together, the quarter's underlying improvement is best seen at the adjusted line, which is precisely why the company changed its segment profit measure from operating profit to adjusted operating profit this quarter, restating the prior year on the same basis.
Industry & Mobility more than doubled its profit
Every reporting segment grew revenue, and the profit spread between them is wide. Industry & Mobility is the standout: revenue up 17.7% to ¥446,279 million and adjusted operating profit up 128.8% to ¥57,135 million. The supplementary disclosure splits it: FA systems grew revenue 30% and adjusted operating profit 130%, to ¥234.2 billion and ¥37.4 billion respectively, while automotive equipment grew revenue 6% and adjusted operating profit 126%, to ¥216.7 billion and ¥19.6 billion. Factory automation swinging that hard is the clearest single read on the industrial capex cycle in this filing.
Life remains the largest segment by revenue, up 11.9% to ¥631,031 million, with adjusted operating profit up 32.2% to ¥60,809 million. Inside it, air-conditioning and home appliances grew revenue 12% to ¥470.5 billion and adjusted operating profit 39% to ¥47.1 billion, and building systems grew revenue 8% to ¥166.6 billion and profit 12% to ¥13.6 billion. Note that a business previously reported under 'Other' was moved into air-conditioning and home appliances this quarter, with the prior year restated.
Semiconductor & Device produced the second-best profit growth: revenue up 17.3% to ¥73,297 million and adjusted operating profit up 81.5% to ¥16,225 million, a segment margin above 20% on the total-revenue basis. Infrastructure grew revenue 12.3% to ¥295,549 million and profit 18.1% to ¥22,448 million, but its internals diverge sharply: defence and space revenue grew 37% to ¥84.8 billion with adjusted operating profit rising from ¥0.4 billion to ¥8.6 billion, and energy systems revenue grew 13% with profit up 64%, while social systems revenue fell 3% and its adjusted operating profit fell to just ¥4.0 billion, 32% of the prior year's.
Two segments went backwards on profit. Digital Innovation grew revenue 14.8% to ¥20,313 million but adjusted operating profit fell 30.8% to ¥861 million — a reminder that the Serendie-centred digital business is still in an investment phase. Other grew revenue 15.3% to ¥30,640 million with profit down 7.3% to ¥4,867 million. Unallocated corporate expense and eliminations widened 55.7% to ¥18,027 million, absorbing a meaningful part of the segment gains.
Orders point the same way — with one exception
The order book, disclosed in ¥100 million units, largely corroborates the profit picture. Infrastructure orders rose 31% to ¥496.1 billion, within which energy systems orders rose 80% to ¥207.1 billion and social systems 37% to ¥153.8 billion. FA systems orders rose 42% to ¥287.0 billion, consistent with the segment's profit surge. Semiconductor & Device orders rose 53% to ¥82.6 billion, Digital Innovation 23% to ¥43.3 billion, and building systems 10% to ¥193.0 billion.
The exception is defence and space, where orders fell 10% to ¥135.1 billion even as revenue grew 37% and profit went from ¥0.4 billion to ¥8.6 billion. That is a segment converting an existing backlog at improving margins rather than replenishing it — worth watching, though a 10% decline against a prior-year quarter that had itself grown 179% is a base effect as much as anything.
Overseas grew twice as fast as Japan, and currency is the reason
Revenue by customer location shows the shape of the quarter clearly. Japan grew 8.7% to ¥646,512 million, its share falling to 43.2% from 45.3%. Overseas revenue grew 18.4% to ¥850,597 million, taking the overseas share to 56.8% from 54.7%. Within that, Asia grew 26.1% to ¥364,354 million — with China up to ¥175,517 million from ¥131,250 million — Europe 18.9% to ¥235,472 million, and North America 8.4% to ¥225,255 million, with the United States at ¥203,784 million.
A large part of that overseas growth is translation. The quarter's average rates were ¥161 to the US dollar, ¥186 to the euro and ¥23.6 to the Chinese yuan, against ¥144, ¥165 and ¥19.9 in the same quarter a year earlier — a yen roughly 12% weaker against the dollar, 13% against the euro and 19% against the yuan. That matters for the guidance discussed below, because the company assumes a materially stronger yen from the second quarter onwards: ¥150, ¥175 and ¥21.5. On those assumptions the currency tailwind not only stops but reverses.
Research and development spending was ¥56.8 billion in the quarter, up 2% and equal to 3.8% of revenue against 4.2% a year earlier — R&D growing far more slowly than revenue is itself part of this quarter's margin expansion. The full-year plan is ¥250.0 billion, up 6%, at 4.0% of revenue.
A stronger balance sheet
Total assets fell 1.5% to ¥7,248,234 million while total equity rose 1.9% to ¥4,718,669 million and equity attributable to shareholders 1.9% to ¥4,571,550 million. The combination lifted the equity ratio to 63.1% from 60.9%, a 2.2-point improvement in a single quarter — unusually strong for a company of this size, and driven by retained profit and the ¥157,163 million of comprehensive income rather than by any balance-sheet action.
Comprehensive income of ¥157,163 million, up 57.3%, exceeded net profit by ¥47 billion, which on a group with this much overseas exposure is again largely currency translation. The same yen weakness that flattered the revenue line inflated the equity account.
Guidance revised upward; dividend raised to ¥60
Mitsubishi Electric revised its full-year forecast with these results. The FY3/2027 plan is revenue of ¥6,270,000 million, up 6.4%, adjusted operating profit of ¥620,000 million, up 23.7%, pre-tax profit of ¥670,000 million, up 27.4%, and net profit attributable to shareholders of ¥495,000 million, up 21.4%, for EPS of ¥241.87.
Measured against that plan the quarter delivered 23.9% of guided revenue, 23.3% of guided adjusted operating profit, 23.4% of guided pre-tax profit and 22.2% of guided net profit — a straight-line quarter almost exactly, which is a comfortable but not commanding start. The more informative comparison is with the segment plans: Industry & Mobility is guided to grow adjusted operating profit 57% for the year after a 129% first quarter, and Life 27% after 32%, so the plan already assumes the growth rate moderates. Semiconductor & Device is guided down 7% for the year after an 81% first quarter, and Digital Innovation down 17%.
Three things are therefore doing the work in the second half of the plan, and each is worth naming. The currency assumption reverses from a weak yen to ¥150/¥175/¥21.5. The depreciation change continues to add to reported profit but, being a level shift, contributes progressively less to growth. And the special retirement expense of ¥9,904 million is a first-quarter charge that ought not recur at that scale. Netting those, the underlying trading momentum the order book points to — FA up 42%, energy up 80%, semiconductors up 53% — is what the guidance ultimately rests on.
The dividend rises. FY3/2026 paid ¥55.00 per share — ¥25.00 interim and ¥30.00 at the year-end — and FY3/2027 is guided at ¥60.00, split ¥30.00 and ¥30.00, unchanged from the previously published forecast. On guided EPS of ¥241.87 that is a payout ratio of about 25%, leaving substantial room for the shareholder returns a 63.1% equity ratio would comfortably support.
| Metric | Q1 FY3/2027 | Q1 FY3/2026 | Change |
|---|---|---|---|
| Revenue (¥ million) | 1,497,109 | 1,312,896 | +14.0% |
| Adjusted operating profit (¥ million) | 144,318 | 93,851 | +53.8% |
| Adjusted operating margin | 9.64% | 7.15% | +2.49 pt |
| — gain on sale of businesses and assets (¥ million) | 2,514 | 15,764 | −84.0% |
| — special retirement expense (¥ million) | −9,904 | — | — |
| Operating profit (¥ million) | 139,501 | 111,972 | +24.6% |
| Operating margin | 9.32% | 8.53% | +0.79 pt |
| Pre-tax profit (¥ million) | 157,077 | 124,076 | +26.6% |
| Net profit attrib. to owners of parent (¥ million) | 109,817 | 90,926 | +20.8% |
| Comprehensive income (¥ million) | 157,163 | 99,931 | +57.3% |
| EPS (¥) | 53.66 | 43.89 | +22.3% |
| Infrastructure — revenue (¥ million) | 295,549 | 263,191 | +12.3% |
| Infrastructure — adjusted operating profit (¥ million) | 22,448 | 19,014 | +18.1% |
| Industry & Mobility — revenue (¥ million) | 446,279 | 379,143 | +17.7% |
| Industry & Mobility — adjusted operating profit (¥ million) | 57,135 | 24,976 | +128.8% |
| Life — revenue (¥ million) | 631,031 | 563,818 | +11.9% |
| Life — adjusted operating profit (¥ million) | 60,809 | 46,000 | +32.2% |
| Digital Innovation — revenue (¥ million) | 20,313 | 17,689 | +14.8% |
| Digital Innovation — adjusted operating profit (¥ million) | 861 | 1,244 | −30.8% |
| Semiconductor & Device — revenue (¥ million) | 73,297 | 62,471 | +17.3% |
| Semiconductor & Device — adjusted operating profit (¥ million) | 16,225 | 8,941 | +81.5% |
| Other — revenue (¥ million) | 30,640 | 26,584 | +15.3% |
| Other — adjusted operating profit (¥ million) | 4,867 | 5,253 | −7.3% |
| Corporate expense and eliminations, adjusted OP (¥ million) | −18,027 | −11,577 | +55.7% |
| Revenue — Japan (¥ million) | 646,512 | 594,583 | +8.7% |
| Revenue — overseas (¥ million) | 850,597 | 718,313 | +18.4% |
| — of which Asia (¥ million) | 364,354 | 288,916 | +26.1% |
| — of which Europe (¥ million) | 235,472 | 198,099 | +18.9% |
| — of which North America (¥ million) | 225,255 | 207,774 | +8.4% |
| Total assets (¥ million) | 7,248,234 | 7,357,512 | −1.5% |
| Total equity (¥ million) | 4,718,669 | 4,629,993 | +1.9% |
| Equity attrib. to owners of parent (¥ million) | 4,571,550 | 4,484,266 | +1.9% |
| Equity ratio | 63.1% | 60.9% | +2.2 pt |
| FY3/2027 guidance — revenue (¥ million) | 6,270,000 | — | +6.4% |
| FY3/2027 guidance — adjusted operating profit (¥ million) | 620,000 | — | +23.7% |
| FY3/2027 guidance — pre-tax profit (¥ million) | 670,000 | — | +27.4% |
| FY3/2027 guidance — net profit (¥ million) | 495,000 | — | +21.4% |
| FY3/2027 guidance — EPS (¥) | 241.87 | — | — |
| Annual dividend per share (¥) | 60.00 | 55.00 | +9.1% |
JapanStockPulse provides informational content only and does not constitute investment advice. Figures are taken from the company's published earnings short report and may be subject to subsequent revision.