Ahead of both last year and its own plan
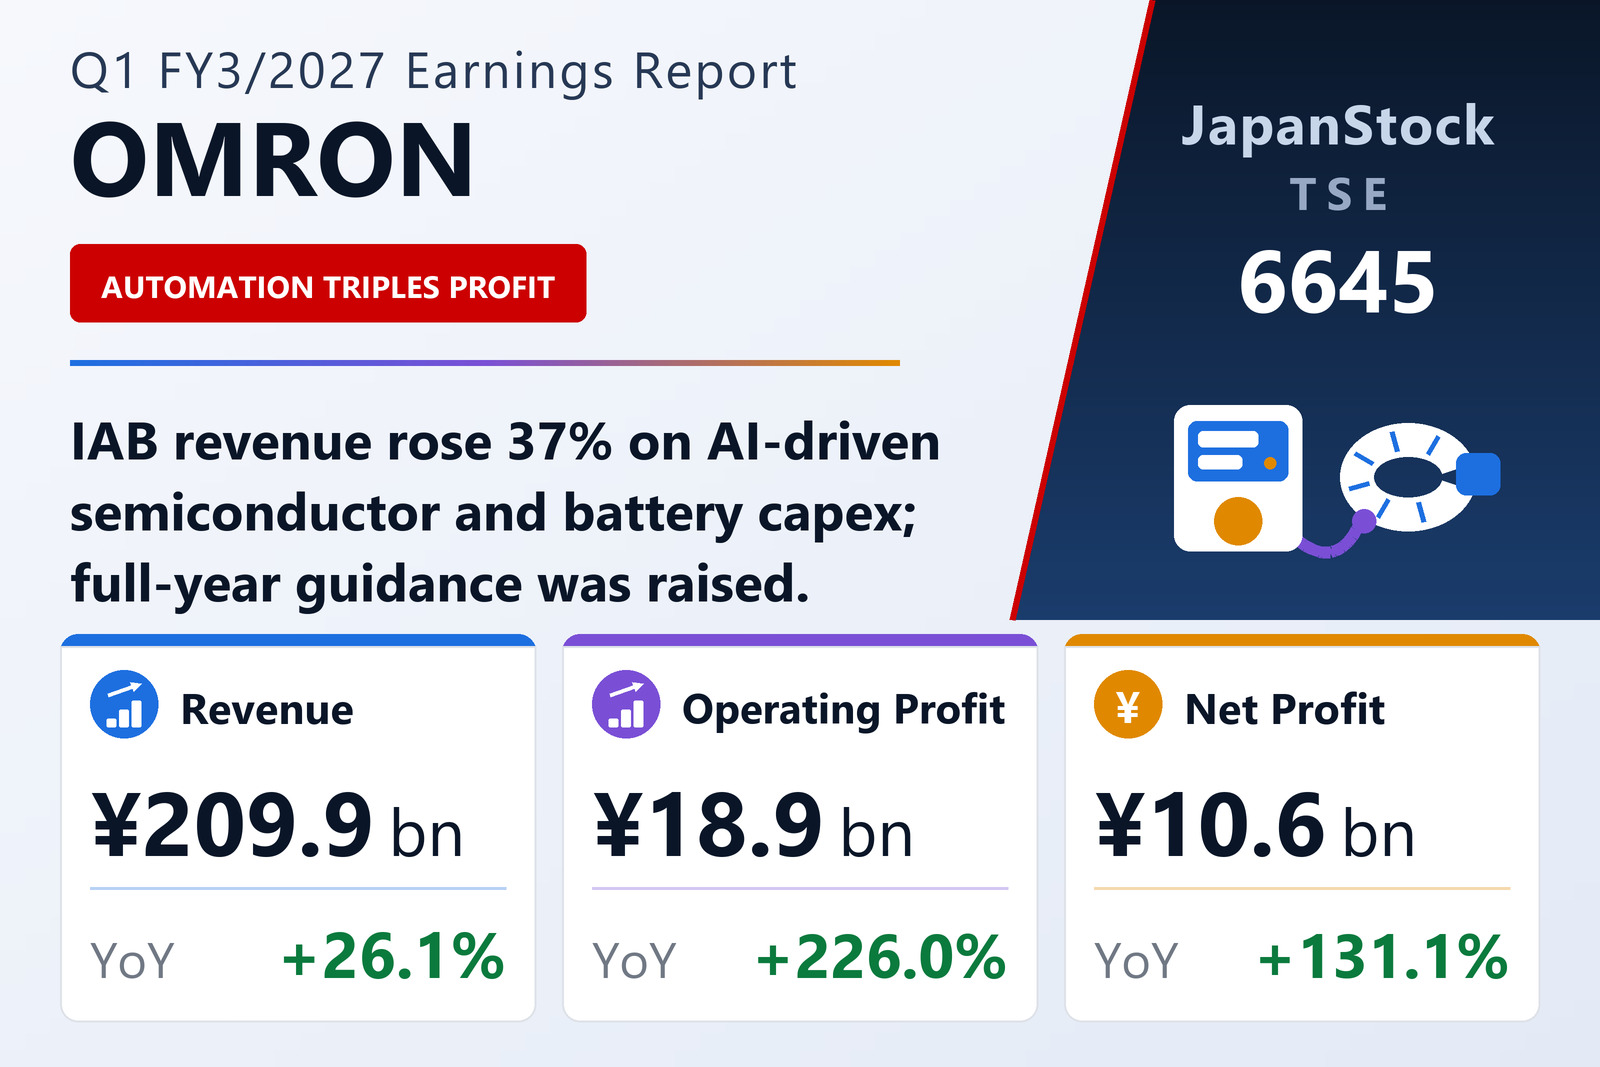
OMRON Corporation (TSE: 6645) published consolidated first-quarter results for FY3/2027 on August 5, 2026, covering April 1 to June 30, 2026 under IFRS. Revenue rose 26.1% to ¥209,864 million and gross profit 28.8% to ¥97,500 million, widening the gross margin by one point to 46.5%. Operating profit climbed 226.0% to ¥18,857 million, profit before tax 217.8% to ¥18,483 million and net profit attributable to owners of the parent 131.1% to ¥10,635 million, for earnings per share of ¥54.08 against ¥23.37.
Management said both revenue and operating profit ran well ahead of the prior year and of its own start-of-year assumptions. Prior-year comparatives have been restated to exclude the Device & Module Solutions business, which was classified as a discontinued operation and is being carved out into a subsidiary.
Automation does the heavy lifting
Industrial Automation, which now supplies almost two-thirds of external revenue, grew 37.2% to ¥131,194 million and doubled segment profit to ¥21,252 million from ¥10,585 million. Omron attributed the gain to capturing semiconductor investment driven by AI demand and secondary-battery investment for data centres, alongside a broader customer base built through closer distributor relationships and a wider product line-up.
Healthcare grew revenue 16.7% to ¥36,432 million and roughly doubled segment profit to ¥2,401 million, helped by online sales promotions for blood-pressure monitors in Japan and Asia. Data Solutions lifted revenue 22.8% to ¥13,065 million and swung to a ¥253 million profit from a ¥51 million loss. Social Systems was the exception: revenue slipped 2.0% to ¥24,249 million and segment profit fell 62.5% to ¥64 million, as weak energy-storage system sales offset steady rail and management-service work.
Guidance raised across the board
On the strength of the quarter and an expectation that semiconductor and battery capex will stay above plan, Omron revised upward the full-year forecast it issued on May 13, 2026. Revenue guidance rose to ¥880,000 million from ¥820,000 million, operating profit to ¥80,000 million from ¥62,000 million, profit before tax to ¥79,000 million from ¥61,000 million, profit from continuing operations to ¥58,000 million from ¥45,000 million, and net profit attributable to owners of the parent to ¥40,500 million from ¥27,500 million. Against FY3/2026 actuals, the new numbers represent growth of 14.6% in revenue, 41.7% in operating profit and 82.1% in net profit.
Segment guidance was raised most for Industrial Automation, whose external revenue forecast went to ¥500,000 million from ¥440,000 million and operating profit to ¥65,000 million from ¥44,000 million. Healthcare was nudged up, Data Solutions left unchanged, and Social Systems trimmed — revenue to ¥148,000 million from ¥153,000 million and operating profit to ¥19,500 million from ¥22,500 million — on a tougher competitive environment in residential renewables. Assumed exchange rates from the second quarter onward were changed to ¥155 to the dollar, ¥180 to the euro and ¥23 to the yuan.
Total assets rose 1.5% to ¥1,384,140 million, held up by cash and equivalents accumulated against the capital restructuring of the discontinued business and a partial return of retirement benefit trust assets. Equity attributable to owners of the parent grew 1.2% to ¥832,083 million for a ratio of 60.1%. The company holds ¥217,900 million in cash and deposits plus a ¥70,000 million committed credit line. The annual dividend forecast is ¥110.00 per share against ¥104.00 for FY3/2026; the interim and year-end split has not yet been determined. Note that the ¥205.97 forecast earnings per share includes discontinued operations; on continuing operations alone the company calculates ¥294.97.
| Metric | Q1 FY3/2027 | Q1 FY3/2026 | Change |
|---|---|---|---|
| Revenue (¥ million) | 209,864 | 166,480 | +26.1% |
| Gross profit (¥ million) | 97,500 | 75,700 | +28.8% |
| Gross margin | 46.5% | 45.5% | +1.0 pt |
| Operating profit (¥ million) | 18,857 | 5,784 | +226.0% |
| Pre-tax profit (¥ million) | 18,483 | 5,816 | +217.8% |
| Net profit (¥ million) | 10,958 | 4,927 | +122.4% |
| Net profit attrib. to owners of parent (¥ million) | 10,635 | 4,601 | +131.1% |
| Comprehensive income (¥ million) | 20,992 | 6,048 | +247.1% |
| EPS (¥) | 54.08 | 23.37 | +131.4% |
| Industrial Automation (IAB) — revenue (¥ million) | 131,194 | 95,637 | +37.2% |
| Industrial Automation (IAB) — segment profit (¥ million) | 21,252 | 10,585 | +100.8% |
| Healthcare (HCB) — revenue (¥ million) | 36,432 | 31,222 | +16.7% |
| Healthcare (HCB) — segment profit (¥ million) | 2,401 | 1,190 | +101.7% |
| Social Systems (SSB) — revenue (¥ million) | 24,249 | 24,753 | -2.0% |
| Social Systems (SSB) — segment profit (¥ million) | 64 | 171 | -62.5% |
| Data Solutions (DSB) — revenue (¥ million) | 13,065 | 10,643 | +22.8% |
| Data Solutions (DSB) — segment profit (¥ million) | 253 | -51 | loss to profit |
| Total assets (¥ million) | 1,384,140 | 1,363,359 | +1.5% |
| Equity attrib. to owners of parent (¥ million) | 832,083 | 821,812 | +1.2% |
| Equity ratio | 60.1% | 60.3% | -0.2 pt |
| FY3/2027 guidance — revenue (¥ million) | 880,000 | — | +14.6% |
| FY3/2027 guidance — operating profit (¥ million) | 80,000 | — | +41.7% |
| FY3/2027 guidance — pre-tax profit (¥ million) | 79,000 | — | +46.9% |
| FY3/2027 guidance — net profit (¥ million) | 40,500 | — | +82.1% |
| FY3/2027 guidance — EPS (¥) | 205.97 | — | — |
| Annual dividend per share | 110.00 | 104.00 | +5.8% |
JapanStockPulse provides informational content only and does not constitute investment advice. Figures are taken from the company's published earnings short report and may be subject to subsequent revision.