Revenue up 14.4%, with a weaker yen doing part of the work
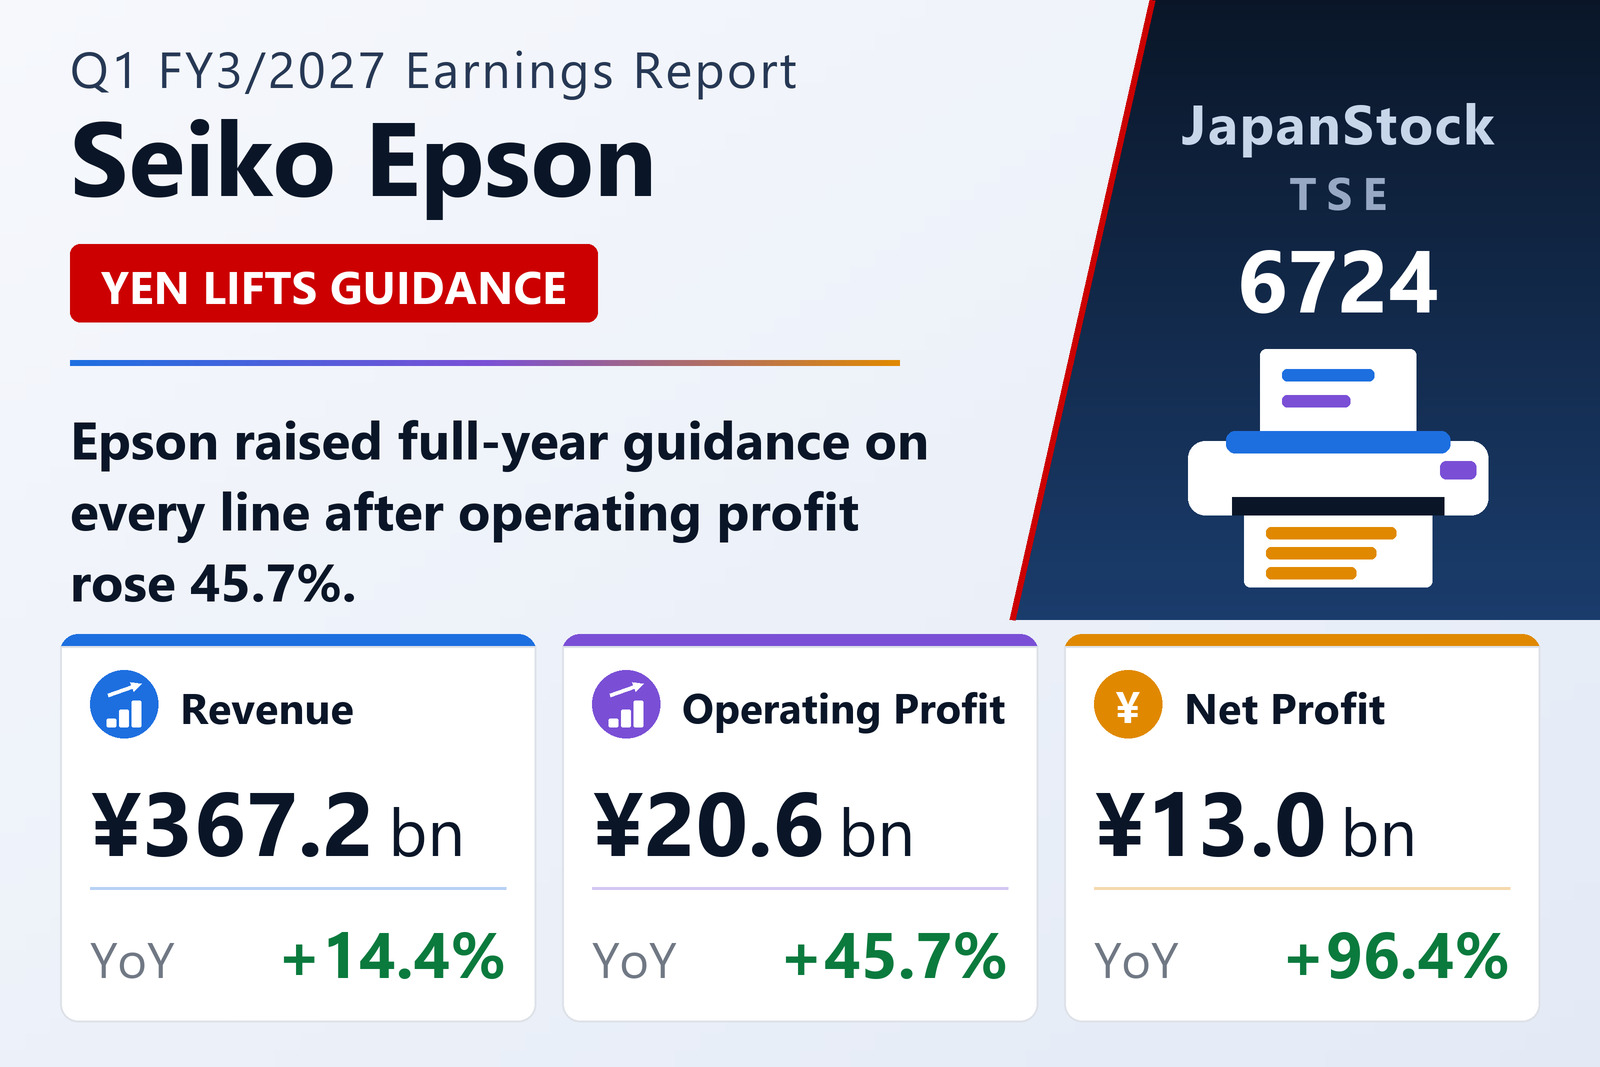
Seiko Epson Corporation (TSE: 6724), the Nagano-based maker of inkjet printers, projectors, quartz devices and industrial robots, reported consolidated first-quarter results for the three months to June 30, 2026 under IFRS on August 5, 2026. Revenue rose 14.4% to ¥367,241 million from ¥320,879 million. Business profit — the company's own measure, revenue less cost of sales and selling, general and administrative expenses — rose 12.0% to ¥22,122 million. Operating profit rose 45.7% to ¥20,601 million, profit before tax 60.4% to ¥20,726 million, and profit attributable to owners of the parent 96.4% to ¥12,984 million. Basic earnings per share were ¥40.52 against ¥20.64.
Those growth rates widen steadily as they descend the income statement, and each step has a separate cause. Between business profit and operating profit sits other operating income and expense, which cost the group ¥1,521 million this quarter against ¥5,619 million a year earlier — a swing of ¥4,098 million that accounts for almost the entire difference between a 12.0% gain and a 45.7% one. Below that, finance income and expense turned from a ¥1,218 million net cost into a ¥125 million net gain. The 96.4% jump at the bottom then owes something to tax: the charge was ¥7,744 million on ¥20,726 million of pre-tax profit, an effective rate of 37.4%, against ¥6,305 million on ¥12,918 million, or 48.8%, a year earlier.
Currency is a visible part of the top line. The quarter's average rates were ¥159.38 to the U.S. dollar and ¥185.33 to the euro, weaker by 10% and 13% respectively than in the same quarter of 2025. Epson sells the large majority of its output outside Japan, so translation alone lifts reported revenue, and management cites the exchange effect as a contributor to both revenue and profit in every one of its four segments.
Precision Innovation leads; printing margins give way to oil costs
Epson changed its reporting structure this year under a new long-term vision, "ENGINEERED FUTURE 2035", splitting the group into four reportable segments. Precision Innovation — inkjet solutions and microdevices — was the standout, with revenue of ¥49.8 billion, up 23.5%, and segment profit of ¥15.5 billion, up 62.1%. Inkjet solutions recovered from a year-earlier order trough and added new customers; microdevices benefited from continued growth in crystal devices and a recovery in semiconductor demand.
Industrial & Robotics produced revenue of ¥82.0 billion, up 17.9%, and profit of ¥5.5 billion, up 44.1%, on commercial and industrial printing hardware plus robotics demand in China and the rest of Asia. Between them those two segments generated ¥21.0 billion of the group's ¥36.6 billion of pre-adjustment segment profit.
The two consumer-facing segments moved the other way on profit even as revenue grew. Office & Home Printing, the largest at ¥167.0 billion of revenue, up 12.3%, saw profit fall 21.7% to ¥11.4 billion: hardware unit sales of both cartridge and high-capacity ink-tank models were roughly level with a year earlier, and higher costs tied to the crude oil price outweighed the revenue and currency gains. Visual & Lifestyle, at ¥67.2 billion, up 7.2% on World Cup-related projector demand in South America and Europe and firm watch-movement and inbound sales, saw profit fall 30.1% to ¥4.2 billion for the same cost reason. Corporate adjustments — basic research and headquarters items not allocated to segments — were a negative ¥14.5 billion against a negative ¥14.3 billion.
Guidance lifted on every line, part of it a tariff refund
Alongside the quarter, Epson raised full-year guidance across the board. Revenue is now guided to ¥1,510.0 billion against ¥1,450.0 billion in the May forecast — an increase of ¥60.0 billion, or 4.1%, and 6.8% above the ¥1,413.3 billion recorded in FY3/2026. Business profit goes to ¥105.0 billion from ¥90.0 billion (+¥15.0 billion, +16.7%); operating profit to ¥101.0 billion from ¥86.0 billion (+¥15.0 billion, +17.4%); profit before tax to ¥99.0 billion from ¥84.0 billion (+¥15.0 billion, +17.9%); and profit attributable to owners to ¥69.0 billion from ¥59.0 billion (+¥10.0 billion, +16.9%), for EPS of ¥215.34.
The company attributes the revenue upgrade to the weaker yen, and the business-profit upgrade to currency plus a one-off gain from a refund of U.S. tariffs. The underlying assumption has moved with it: full-year rates are now ¥156.00 to the dollar and ¥178.00 to the euro, against ¥151.00 and ¥175.00 in May, with ¥155.00 and ¥176.00 assumed from the second quarter onward. Because part of the upgrade is a refund rather than trading performance, that portion of the raised profit does not repeat.
Measured against FY3/2026, the guided growth rates look steepest at the bottom of the statement precisely because the comparison base is low: operating profit is guided up 103.8% from ¥49.6 billion and net profit up 279.1% from ¥18.2 billion, while business profit — the measure least disturbed by last year's charges — is guided up a more moderate 25.3% from ¥83.8 billion. On the quarter's ¥22.1 billion, the group has booked 21.1% of the raised full-year business-profit target in the first three months of a twelve-month year.
Balance sheet, comprehensive income and the dividend
Total assets stood at ¥1,580,342 million at June 30, up ¥45,472 million from March 31. Total equity rose to ¥865,427 million from ¥853,648 million, of which ¥865,284 million is attributable to owners of the parent; because assets grew faster than equity, the ratio of owners' equity to total assets slipped to 54.8% from 55.6%. Total comprehensive income for the quarter was ¥23,595 million against a negative ¥3,624 million a year earlier, a swing driven largely by translating overseas net assets at the weaker yen.
The dividend forecast is unchanged: ¥40.00 at the half-year and ¥40.00 at the year-end for a full-year ¥80.00, against ¥37.00 and ¥37.00 for a ¥74.00 total in FY3/2026 — an 8.1% increase. Shares issued were 373,573,152 at both period ends.
| Metric | Q1 FY3/2027 | Q1 FY3/2026 | Change |
|---|---|---|---|
| Revenue (¥ million) | 367,241 | 320,879 | +14.4% |
| Business profit (¥ million) | 22,122 | 19,755 | +12.0% |
| Operating profit (¥ million) | 20,601 | 14,136 | +45.7% |
| Profit before tax (¥ million) | 20,726 | 12,918 | +60.4% |
| Profit attrib. to owners of parent (¥ million) | 12,984 | 6,612 | +96.4% |
| Basic EPS (¥) | 40.52 | 20.64 | +96.3% |
| Total comprehensive income (¥ million) | 23,595 | −3,624 | to profit |
| Average USD rate (¥) | 159.38 | — | yen 10% weaker |
| Average EUR rate (¥) | 185.33 | — | yen 13% weaker |
| Total assets (¥ million) * | 1,580,342 | 1,534,870 | +3.0% |
| Equity attrib. to owners (¥ million) * | 865,284 | 853,503 | +1.4% |
| Owners' equity ratio * | 54.8% | 55.6% | −0.8 pt |
JapanStockPulse provides informational content only and does not constitute investment advice. Figures are taken from the company's published earnings short report and may be subject to subsequent revision.