A quarter carried by industrial film
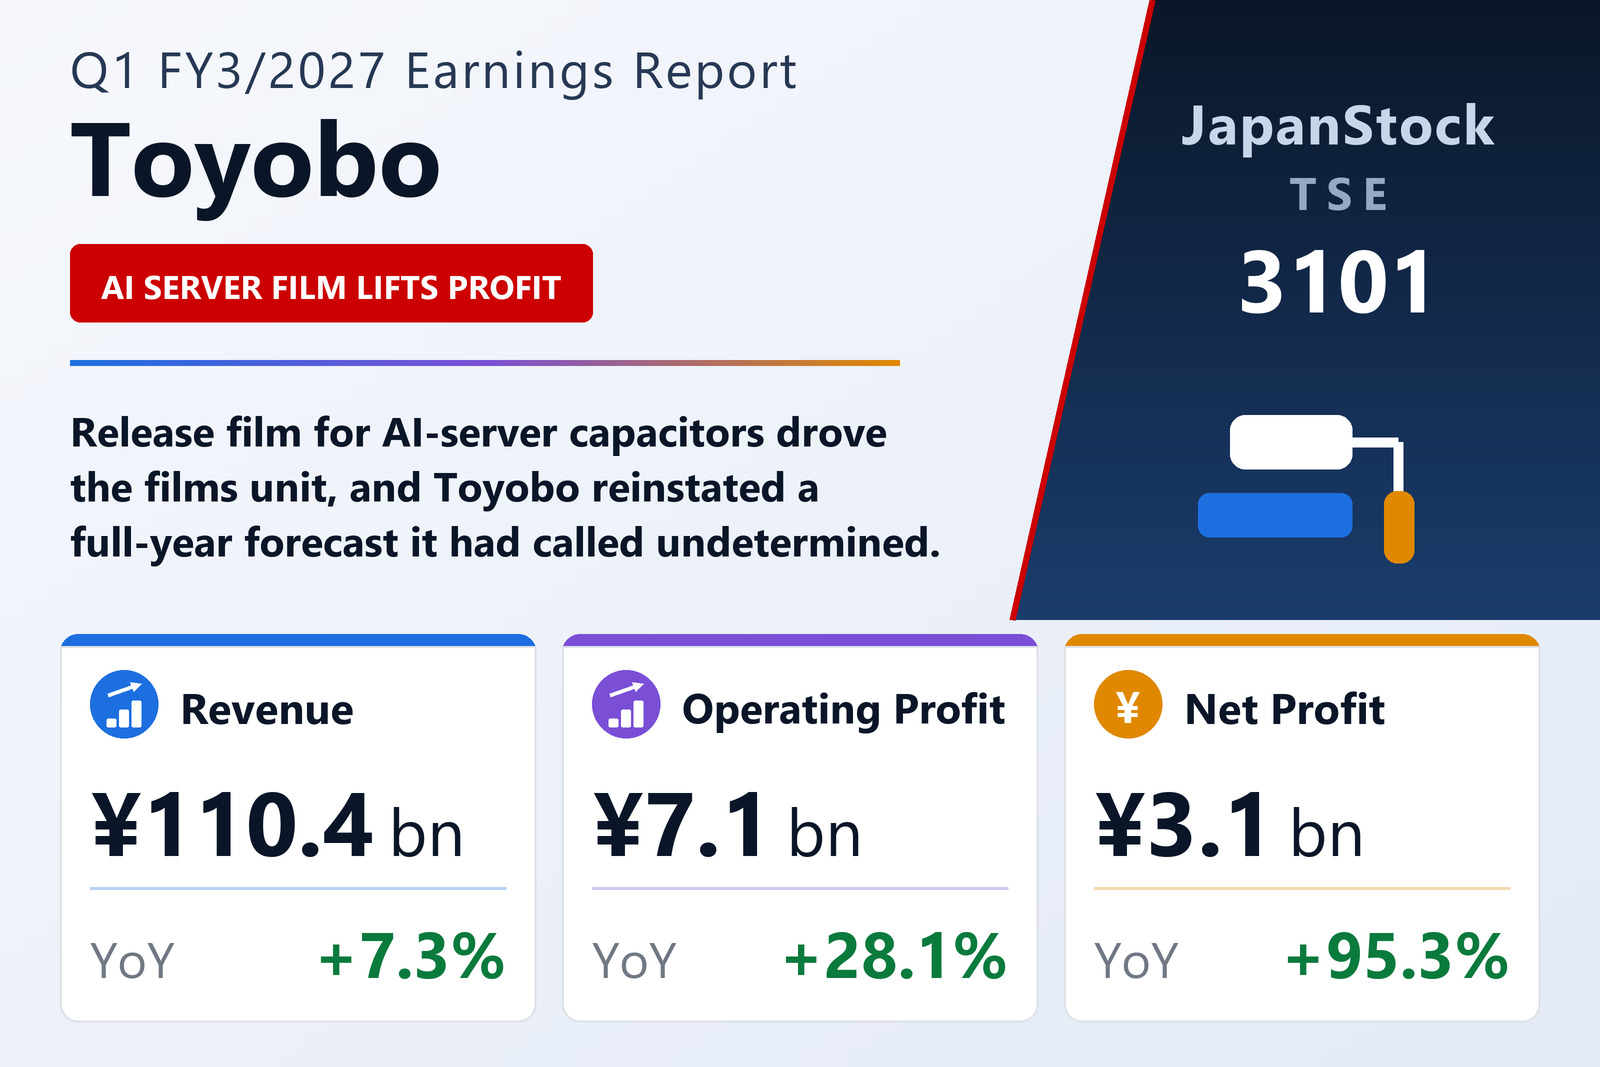
Toyobo Co., Ltd. (TSE: 3101), the Osaka-based maker of packaging and industrial films, engineering plastics, high-performance fibres and bioscience reagents, published consolidated results for the first quarter of FY3/2027 — April 1 to June 30, 2026 — under Japanese GAAP on August 6, 2026. Revenue rose 7.3% to ¥110,373 million from ¥102,910 million, reversing a 2.2% decline in the same quarter a year earlier. Every profit line rose faster than that: operating profit up 28.1% to ¥7,132 million, ordinary profit up 55.3% to ¥6,626 million, and net profit attributable to owners of parent up 95.3% to ¥3,072 million. The three accelerations have three different causes, and only the first of them is operating.
The step from revenue to operating profit is a cost-discipline story rather than a pricing one. Cost of sales rose 6.8% to ¥83,006 million, marginally slower than revenue, so gross profit rose 8.7% to ¥27,367 million and the gross margin widened only slightly, to 24.8% from 24.5%. The real work happened one line lower: selling, general and administrative expenses rose just 3.2% to ¥20,235 million, less than half the pace of revenue, taking the SG&A ratio down to 18.3% from 19.1%. ¥2,184 million of additional gross profit against ¥618 million of additional SG&A leaves ¥1,566 million — precisely the operating-profit increase. The operating margin reached 6.5%, from 5.4%.
What produced the volume is narrow and identifiable. Release film for multilayer ceramic capacitors expanded steadily, led by AI-server applications; "Cosmoshine SRF", the protective film for LCD polarisers, held firm on strong demand; engineering plastics and the "Vylon" industrial adhesive both sold more. Those gains had to absorb a step-up in fixed cost along the way: depreciation, including amortisation of intangibles, rose 18.8% to ¥6,958 million from ¥5,859 million. Against an operating-profit gain of ¥1,566 million, that is a ¥1,099 million headwind the quarter has already paid.
Below the operating line: a currency loss that did not repeat
Ordinary profit's 55.3% gain nearly doubles operating profit's 28.1%, and a single line explains most of it. Non-operating expenses fell to ¥1,268 million from ¥2,004 million because the prior year carried a ¥916 million foreign-exchange loss that did not recur; interest expense meanwhile rose 14.5% to ¥768 million, consistent with a slightly heavier interest-bearing debt load. Non-operating income edged up to ¥762 million from ¥704 million even though dividends received halved to ¥74 million. Netted out, the drag below the operating line narrowed to ¥506 million from ¥1,300 million — a ¥794 million swing which, added to the ¥1,566 million operating gain, accounts for essentially all of the ¥2,359 million rise in ordinary profit.
Extraordinary losses fell to ¥887 million from ¥1,263 million, but the composition changed completely. The prior year's charge was dominated by a ¥939 million loss on revising the retirement benefit plan — a one-off that cannot repeat — alongside ¥324 million of losses on disposal of fixed assets. This year's total is four smaller items: a ¥392 million write-down of investment securities, ¥225 million of impairment, ¥167 million of losses on disposal of fixed assets and ¥103 million of business restructuring costs. Pre-tax profit therefore rose 91.0% to ¥5,739 million, and a lighter effective tax rate — 28.9% against 34.4% — lifted net profit including minorities 107.2% to ¥4,081 million.
Parent-attributable profit grew more slowly than that, at 95.3%, because non-controlling interests took ¥1,008 million against ¥397 million a year earlier, up 153.9%. Minority shareholders' share of consolidated net profit widened to 24.7% from 20.2%; the group's bottom line grew faster than the number the parent's shareholders actually own. Comprehensive income rose 124.3% to ¥4,442 million on ¥361 million of other comprehensive income, of which a ¥735 million foreign currency translation gain did the work, partly offset by ¥274 million of valuation losses on available-for-sale securities and a ¥185 million retirement benefit adjustment.
Segments: two engines, two loss-makers
Two structural changes land in this quarter. The company revised its reporting segments after reorganising the consolidated subsidiary that ran the trading business: the former "Functional Fibers and Trading" segment is renamed "Textiles", and part of what it contained moved to "Other". Prior-year segment figures below are restated on the new basis, so the comparisons are like-for-like; consolidated totals are unaffected. Separately, Toyobo STC Co., Ltd. left the scope of consolidation during the quarter — one company removed, none added.
Films, the largest segment, produced external revenue of ¥48,526 million, up 8.9%, and segment profit of ¥5,169 million, up 29.1%, lifting its margin to 10.7% from 9.0%. Industrial film did the lifting — capacitor release film on AI-server demand, "Cosmoshine SRF" on strong polariser demand. Packaging film faced higher fuel and raw-material prices and rising procurement risk, but the company says revisiting selling terms and improving productivity kept the impact partial. Environment and Functional Materials delivered the largest profit gain of any segment: ¥2,783 million against ¥1,463 million, up 90.2%, on revenue of ¥28,843 million, up 13.5%, taking the margin to 9.6% from 5.8%. Engineering plastics grew on automotive applications and "Vylon" sold steadily into overseas electronic-materials uses; within the same segment, reverse-osmosis membranes for seawater desalination fell on the deteriorating Middle East situation, while "Zylon" high-performance fibre recovered and spunbond long-fibre nonwovens improved on construction-material demand.
Two segments went the other way while the headline numbers rose. Life Science grew revenue 13.4% to ¥9,111 million and still swung to an operating loss of ¥478 million from a ¥164 million profit — a ¥642 million deterioration on rising sales. Raw-material enzymes for diagnostic and genetic-testing reagents sold well overseas and hollow-fibre membranes for artificial kidneys held up, but the medical business absorbed fuel and raw-material inflation, and pharmaceutical contract manufacturing saw sales fall on a changing business environment and equipment renewal — a business carrying fixed plant while losing volume. Textiles saw revenue fall 4.1% to ¥18,763 million and its operating loss widen to ¥363 million from ¥83 million, as specialised fabrics bound for the Middle East fell on the regional situation with costs rising against them; airbag base fabric improved on production efficiency and the consolidation of overseas sites.
Real Estate contributed ¥1,100 million of revenue and ¥536 million of profit, and the non-reportable "Other" bucket — trading in industrial goods, design and construction of buildings and machinery, information-processing services and logistics — ¥4,030 million and ¥103 million. Taken together, as the company presents them in its narrative, that is revenue of about ¥5.1 billion, down 3.3%, and profit of about ¥0.6 billion, down 8.8%, broadly on plan. Corporate adjustments took ¥617 million off the total against ¥684 million a year earlier, mostly unallocated basic research. The concentration is stark: Films and Environment and Functional Materials together earned ¥7,952 million of segment profit, more than the entire group's ¥7,132 million, because Life Science and Textiles subtracted ¥841 million between them.
The balance sheet: assets shrink, but the capex is landing
Total assets fell ¥7,010 million, or 1.1%, to ¥620,657 million over the three months. Notes and accounts receivable fell ¥2,006 million to ¥86,202 million, finished goods ¥2,096 million and cash and deposits ¥1,324 million to ¥29,783 million, partly offset by ¥1,671 million more raw materials and supplies and ¥967 million more work in process.
Tangible fixed assets fell ¥2,181 million to ¥297,751 million, but the composition is the opposite of a company shrinking. Construction in progress fell ¥5,939 million to ¥17,083 million while buildings and structures rose ¥1,044 million and machinery, equipment and vehicles rose ¥2,959 million. That is projects being completed and placed into service — which is the direct explanation for the 18.8% jump in depreciation, and a cost the remaining nine months will carry in full.
Liabilities fell ¥5,364 million to ¥370,308 million even though interest-bearing debt rose. Trade payables fell ¥2,678 million to ¥42,397 million and current provisions ¥2,907 million to ¥2,984 million. Against that, short-term borrowings rose ¥5,203 million to ¥59,903 million and the current portion of long-term borrowings ¥5,110 million to ¥17,536 million, while long-term borrowings fell ¥6,965 million to ¥101,380 million, commercial paper was redeemed in full from ¥2,000 million and bonds were unchanged at ¥67,000 million — a net increase of roughly ¥1,348 million in interest-bearing debt, with about ¥5.1 billion of it shifting into the within-one-year bucket.
Net assets fell ¥1,646 million to ¥250,349 million. Retained earnings fell ¥458 million because the ¥3,530 million paid out as the ¥40.00 year-end dividend exceeded the ¥3,072 million earned, and non-controlling interests fell ¥1,401 million to ¥37,280 million despite the ¥1,008 million of profit attributed to them — consistent with the deconsolidation. Because assets shrank slightly faster than shareholders' equity, which was almost flat at ¥213,069 million, the equity ratio rose to 34.3% from 34.0% even as net assets per share slipped to ¥2,414.65 from ¥2,417.30. No quarterly cash-flow statement is prepared.
Guidance restored — and pointed down
Toyobo had declared its FY3/2027 consolidated forecast undetermined, on the grounds that the escalation in the Middle East made a proper and reasonable estimate of the impact on its business impossible. On August 6 it published one, based on currently available information, in a separate release titled "Notice Regarding Full-Year Consolidated Earnings Forecast and Dividend Forecast"; both the earnings forecast and the dividend forecast are flagged as revisions to previously announced figures. The company now guides revenue of ¥435,000 million, up 3.2%, operating profit of ¥23,000 million, down 17.6%, ordinary profit of ¥18,500 million, down 19.1%, and net profit attributable to owners of parent of ¥7,000 million, down 37.4%, for EPS of ¥79.33.
The tension between the quarter and the year is the thing to see. Every Q1 profit line rose sharply; every full-year profit line is guided to fall. Q1 revenue is 25.4% of the annual target — almost exactly a quarter — but Q1 operating profit is 31.0% of the year's ¥23,000 million, ordinary profit 35.8% of its target and net profit 43.9% of its own. Read the other way, the remaining nine months are guided to roughly ¥324.6 billion of revenue and roughly ¥15.9 billion of operating profit, a margin near 4.9% against the 6.5% just delivered, and a full-year guided margin of 5.3%.
The filing gives reasons to read that as a considered estimate rather than boilerplate caution. Two of the businesses most exposed to the Middle East — desalination membranes and Middle East-bound specialised fabrics — are already visibly down in the quarter just reported. Depreciation is stepping up as the construction-in-progress balance converts into operating assets. And the forecast is explicitly an estimate made while the situation that made forecasting impossible in the first place remains unresolved. The company is not claiming visibility; it is claiming enough visibility to publish a number.
The dividend holds at ¥40 — now half of guided earnings
For FY3/2026 Toyobo paid no interim dividend and ¥40.00 at the year-end, ¥40.00 for the year. The FY3/2027 forecast, published the same day, is identical: nothing at the interim, ¥40.00 at the year-end, ¥40.00 in total, and it too is flagged as a revision to the previously announced forecast. On guided EPS of ¥79.33 that is a payout ratio of 50.4%, against roughly a third of what the company earned in FY3/2026. Holding the yen amount flat through a year guided down 37.4% at the net line is a decision to let the payout ratio expand rather than let the dividend follow earnings. Shares issued were unchanged at 89,048,792, with treasury holdings edging up to 808,657 from 804,024.
| Metric | Q1 FY3/2027 | Q1 FY3/2026 | Change |
|---|---|---|---|
| Revenue (¥ million) | 110,373 | 102,910 | +7.3% |
| Cost of sales (¥ million) | 83,006 | 77,726 | +6.8% |
| Gross profit (¥ million) | 27,367 | 25,183 | +8.7% |
| Gross margin | 24.8% | 24.5% | +0.3 pt |
| SG&A expenses (¥ million) | 20,235 | 19,617 | +3.2% |
| Operating profit (¥ million) | 7,132 | 5,566 | +28.1% |
| Operating margin | 6.5% | 5.4% | +1.1 pt |
| Ordinary profit (¥ million) | 6,626 | 4,267 | +55.3% |
| Extraordinary losses (¥ million) | 887 | 1,263 | −29.8% |
| Pre-tax profit (¥ million) | 5,739 | 3,004 | +91.0% |
| Income taxes (¥ million) | 1,658 | 1,034 | +60.3% |
| Net profit incl. minorities (¥ million) | 4,081 | 1,970 | +107.2% |
| Profit attrib. to non-controlling interests (¥ million) | 1,008 | 397 | +153.9% |
| Net profit attrib. to owners of parent (¥ million) | 3,072 | 1,573 | +95.3% |
| Comprehensive income (¥ million) | 4,442 | 1,981 | +124.3% |
| EPS (¥) | 34.82 | 17.84 | +95.2% |
| Depreciation (¥ million) | 6,958 | 5,859 | +18.8% |
| Total assets (¥ million) | 620,657 | 627,667 | −1.1% |
| Total liabilities (¥ million) | 370,308 | 375,672 | −1.4% |
| Net assets (¥ million) | 250,349 | 251,995 | −0.7% |
| Equity ratio | 34.3% | 34.0% | +0.3 pt |
| Net assets per share (¥) | 2,414.65 | 2,417.30 | −0.1% |
| FY3/2027 guidance — revenue (¥ million) | 435,000 | — | +3.2% |
| FY3/2027 guidance — operating profit (¥ million) | 23,000 | — | −17.6% |
| FY3/2027 guidance — ordinary profit (¥ million) | 18,500 | — | −19.1% |
| FY3/2027 guidance — net profit attrib. to owners of parent (¥ million) | 7,000 | — | −37.4% |
| FY3/2027 guidance — EPS (¥) | 79.33 | — | — |
| Dividend per share, full year (¥) | 40.00 | 40.00 | ±0.0% |
| Segment | Revenue Q1 FY3/2027 | Revenue Q1 FY3/2026 | Profit Q1 FY3/2027 | Profit Q1 FY3/2026 |
|---|---|---|---|---|
| Films | 48,526 | 44,576 | 5,169 | 4,005 |
| Life Science | 9,111 | 8,033 | −478 | 164 |
| Environment and Functional Materials | 28,843 | 25,422 | 2,783 | 1,463 |
| Textiles | 18,763 | 19,574 | −363 | −83 |
| Real Estate | 1,100 | 1,114 | 536 | 498 |
| Other | 4,030 | 4,190 | 103 | 203 |
| Corporate adjustments | — | — | −617 | −684 |
| Consolidated total | 110,373 | 102,910 | 7,132 | 5,566 |
JapanStockPulse provides informational content only and does not constitute investment advice. Figures are taken from the company's published earnings short report and may be subject to subsequent revision.