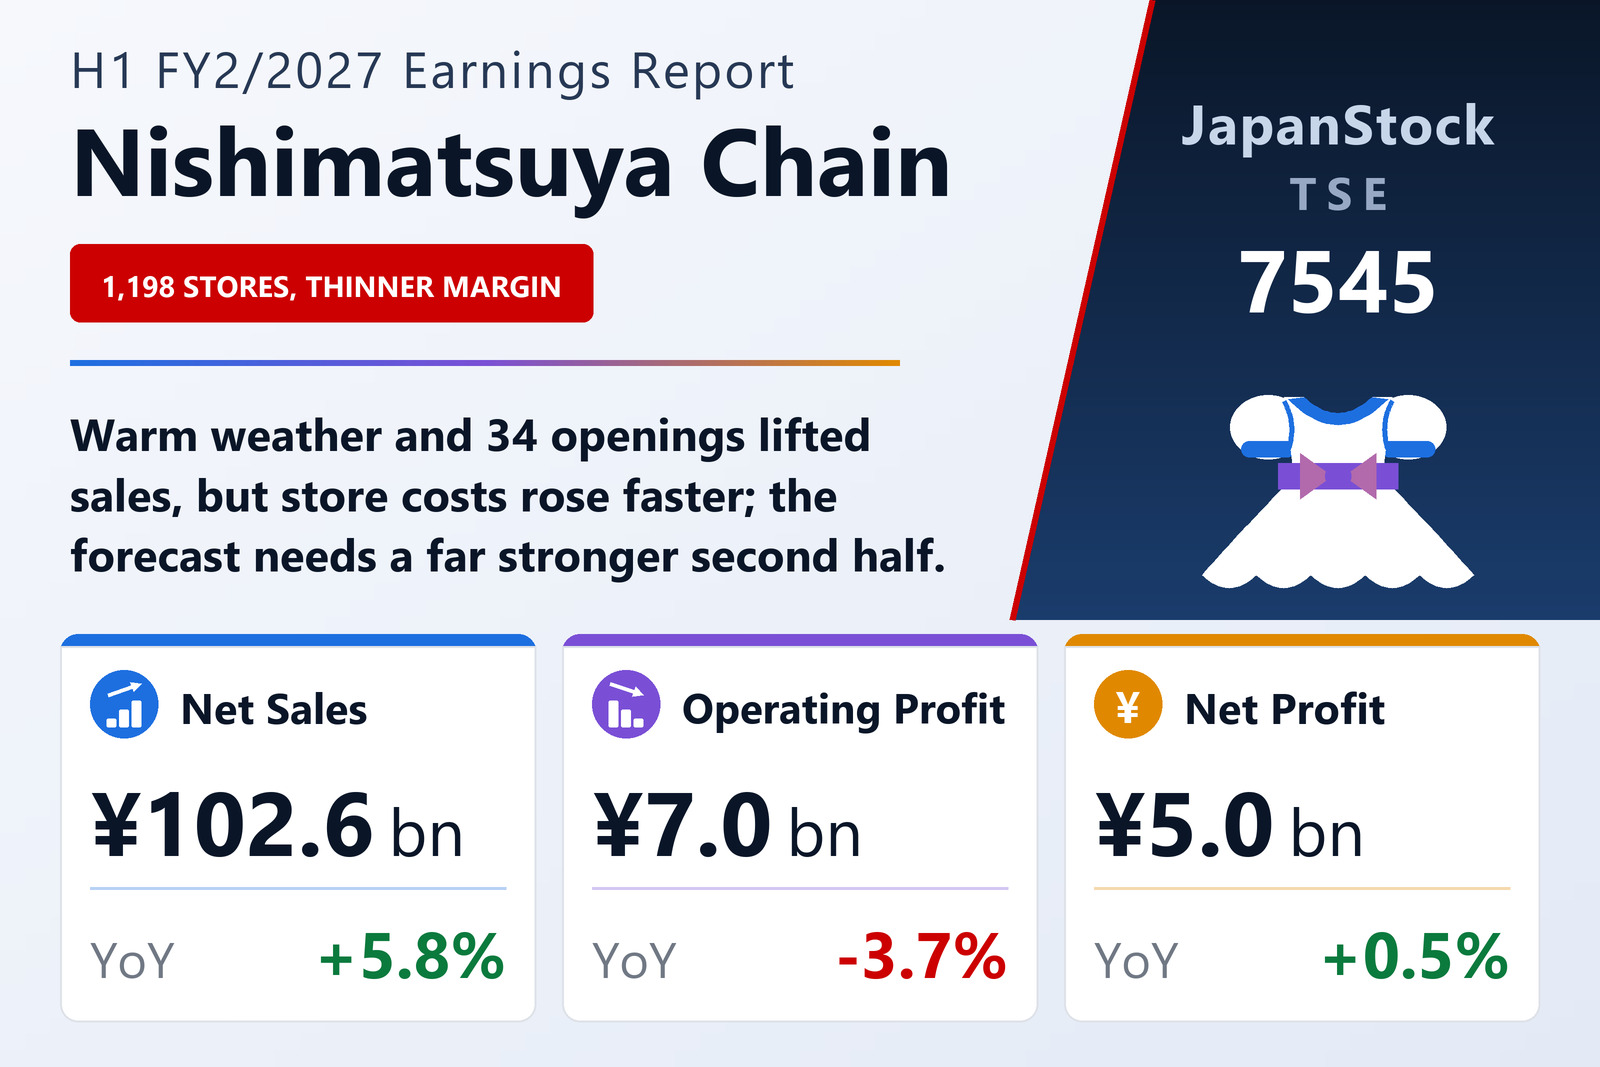
Warm weather and new stores drive sales
Nishimatsuya Chain Co., Ltd. (TSE: 7545), the Himeji-based discount chain selling baby and children's clothing and goods, published consolidated results for the first half of FY2/2027, the period from February 21 to August 20, 2026, on October 1, 2026 under Japanese GAAP. Net sales rose 5.8% to ¥102,636 million, operating profit fell 3.7% to ¥7,032 million and ordinary profit 1.7% to ¥7,378 million, while profit attributable to owners of the parent edged up 0.5% to ¥4,992 million, or ¥83.50 per share against ¥82.79. The company is a single-segment business and does not break results down further.
The chain opened 34 stores and closed 17, ending the period with 1,198. Rising temperatures helped spring and summer clothing, clothing for older primary-school children kept growing, and the goods side sold more baby food, disposable nappies, bath additives, toys, child car seats, beach and pool goods, rainwear and accessories. Sales through its official online store were strong as new memberships increased.
Expansion costs outpace gross profit
Gross profit rose 4.9% to ¥35,690 million, a little slower than sales, so the gross margin eased from 35.1% to 34.8%. Selling, general and administrative expenses rose 7.3% to ¥28,657 million, which the company attributes mainly to the larger store network from its aggressive openings. That squeezed the operating margin from 7.5% to 6.9%. Lower taxes then left net profit marginally higher. Comprehensive income, however, fell 44.0% to ¥3,283 million because the valuation gain on securities held dropped by ¥1,634 million, against a ¥845 million increase a year earlier.
Cash-rich balance sheet
Total assets rose ¥2,567 million to ¥162,819 million from February 20, 2026, mainly because cash and deposits grew ¥2,592 million to ¥75,081 million. Liabilities rose ¥648 million, with income taxes payable and accrued expenses higher and electronically recorded obligations ¥2,529 million lower. Net assets reached ¥100,588 million after ¥958 million of dividends and ¥499 million of share buybacks, and the equity ratio stood at 61.5%, against 61.3%. Operating activities generated ¥5,608 million of cash, ¥2,911 million less than a year earlier, as payables fell.
Forecast relies on a much stronger second half
Nishimatsuya kept the full-year FY2/2027 forecast it published on April 2, 2026: net sales of ¥205,000 million (+6.0%), operating profit of ¥12,540 million (+26.1%), ordinary profit of ¥13,000 million (+23.0%) and net profit of ¥8,377 million (+22.3%), or ¥139.78 per share. With ¥7,032 million earned in the first half, the forecast implies second-half operating profit of about ¥5,508 million, more than double the comparable period of FY2/2026 based on the published growth rates. The company paid an interim dividend of ¥17.00, ¥1.00 more than a year earlier, and the filing notes a revision to its dividend forecast; with a year-end dividend of ¥16.00 planned, the annual total would be ¥33.00 against ¥32.00.
| Metric | H1 FY2/2027 | H1 FY2/2026 | Change |
|---|---|---|---|
| Net sales (¥ million) | 102,636 | 96,973 | +5.8% |
| Gross profit (¥ million) | 35,690 | 34,017 | +4.9% |
| Gross margin | 34.8% | 35.1% | −0.3 pt |
| SG&A expenses (¥ million) | 28,657 | 26,711 | +7.3% |
| Operating profit (¥ million) | 7,032 | 7,305 | −3.7% |
| Operating margin | 6.9% | 7.5% | −0.6 pt |
| Ordinary profit (¥ million) | 7,378 | 7,508 | −1.7% |
| Pre-tax profit (¥ million) | 7,259 | 7,377 | −1.6% |
| Net profit attrib. to owners of parent (¥ million) | 4,992 | 4,969 | +0.5% |
| EPS (¥) | 83.50 | 82.79 | +0.9% |
| Comprehensive income (¥ million) | 3,283 | 5,858 | −44.0% |
| Total assets (¥ million) | 162,819 | 160,251 | +1.6% |
| Net assets (¥ million) | 100,588 | 98,669 | +1.9% |
| Equity ratio | 61.5% | 61.3% | +0.2 pt |
| FY2/2027 guidance — revenue (¥ million) | 205,000 | — | +6.0% |
| FY2/2027 guidance — operating profit (¥ million) | 12,540 | — | +26.1% |
| FY2/2027 guidance — ordinary profit (¥ million) | 13,000 | — | +23.0% |
| FY2/2027 guidance — net profit (¥ million) | 8,377 | — | +22.3% |
| FY2/2027 guidance — EPS (¥) | 139.78 | — | n.m. |
| Annual dividend per share (¥) | 33.00 | 32.00 | +3.1% |
JapanStockPulse provides informational content only and does not constitute investment advice. Figures are taken from the company's published earnings short report and may be subject to subsequent revision.