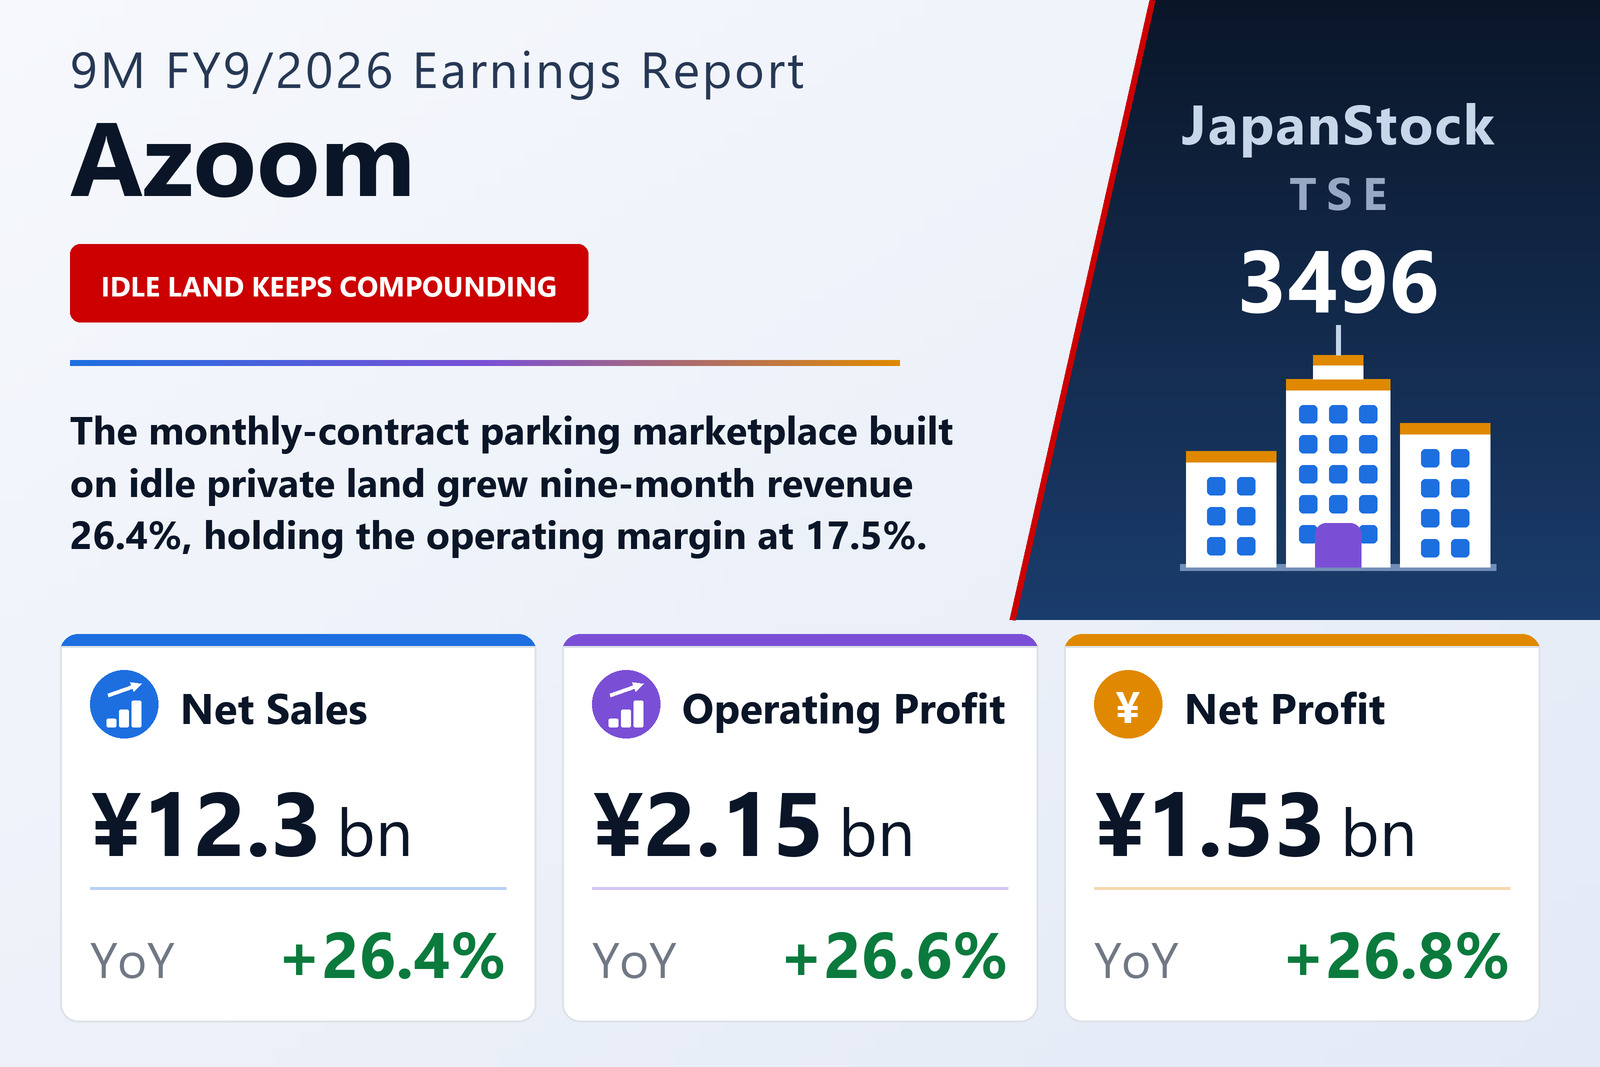
Azoom Co., Ltd. (TSE: 3496), which converts idle and under-used private land into monthly-contract parking through an online marketplace, reported cumulative third-quarter results for the nine months to June 30, 2026 under Japanese GAAP. Net sales rose 26.4% to ¥12,265 million, operating profit rose 26.6% to ¥2,151 million, ordinary profit rose 26.7% to ¥2,144 million, and profit attributable to owners of the parent rose 26.8% to ¥1,529 million. Basic earnings per share came to ¥124.37, against ¥101.92 a year earlier.
A business built on land nobody was using
The Tokyo-based company, led by Representative Director, President and CEO Yoji Sugata, sources vacant lots, awkward gaps beside buildings and other under-utilised private land, then re-lists the space as monthly-contract parking. That idle-asset utilisation segment generated external revenue of ¥12,059 million and segment profit of ¥2,129 million over the nine months — some 98% of group turnover. A much smaller data-visualisation business added ¥206 million of revenue and ¥25 million of segment profit; after ¥2 million of eliminations, the two lines sum to the reported ¥2,151 million operating profit.
Growth above 26% on every line, margins intact
What stands out in the release is its uniformity: sales, operating profit, ordinary profit and net profit all advanced within four-tenths of a percentage point of one another, at 26.4% to 26.8%. The operating margin was 17.5%, unchanged from 17.5% a year earlier, indicating that the incremental parking lots signed over the past year are being monetised at broadly the same economics as the existing book rather than being bought with discounting. Comprehensive income climbed 28.5% to ¥1,540 million, and diluted earnings per share were ¥124.01.
Balance sheet lighter after a large dividend
Total assets stood at ¥8,538 million at June 30, 2026, down from ¥8,894 million at the September 30, 2025 year-end, while net assets fell to ¥6,319 million from ¥6,831 million and shareholders' equity to ¥6,312 million from ¥6,819 million. The equity ratio eased to 73.9% from 76.7%. The decline reflects the sizeable FY2025 year-end dividend paid out during the period rather than any operational deterioration; the company remains close to debt-light with roughly three-quarters of its balance sheet funded by equity.
Azoom carried out a two-for-one stock split effective October 1, 2025, and prior-year per-share figures are restated as if the split had taken place at the start of that year. On the post-split share count, the FY9/2026 dividend forecast is ¥63 at the interim plus ¥63 at the year-end, for ¥126 in total; FY9/2025 paid ¥212 on the pre-split count. Shares issued totalled 12,335,600 with 261 held in treasury, and the weighted-average count for the period was 12,298,529.
Guidance left unchanged — and arguably conservative
Management made no change to its full-year FY9/2026 forecast: net sales of ¥17,000 million (+26.1%), operating profit of ¥3,150 million (+20.5%), ordinary profit of ¥3,140 million (+20.4%), net profit of ¥2,200 million (+20.1%) and EPS of ¥179.27. Three quarters in, the company has already booked 72.1% of the revenue target, 68.3% of the operating-profit target and 69.5% of the net-profit target. Against a straight-line 75% benchmark, that leaves the fourth quarter needing to carry an unusually large share of the year — or, more plausibly for a business compounding at better than 26%, means the full-year bar has been set with room to spare.
| Metric | 9M FY9/2026 | 9M FY9/2025 | Change |
|---|---|---|---|
| Net sales (¥ million) | 12,265 | 9,706 | +26.4% |
| Operating profit (¥ million) | 2,151 | 1,698 | +26.6% |
| Ordinary profit (¥ million) | 2,144 | 1,692 | +26.7% |
| Profit attributable to owners (¥ million) | 1,529 | 1,205 | +26.8% |
| Basic EPS (¥) | 124.37 | 101.92 | +22.0% |
| Idle-asset utilisation segment profit (¥ million) | 2,129 | — | — |
| Equity ratio (%, vs FY25 year-end) | 73.9 | 76.7 | -2.8 pt |
| Annual dividend, forecast (¥) | 126.00 | 212.00 | post-split vs pre-split |
JapanStockPulse provides informational content only and does not constitute investment advice. Figures are taken from the company's published earnings short report and may be subject to subsequent revision.