Intel gains cannot offset the charges
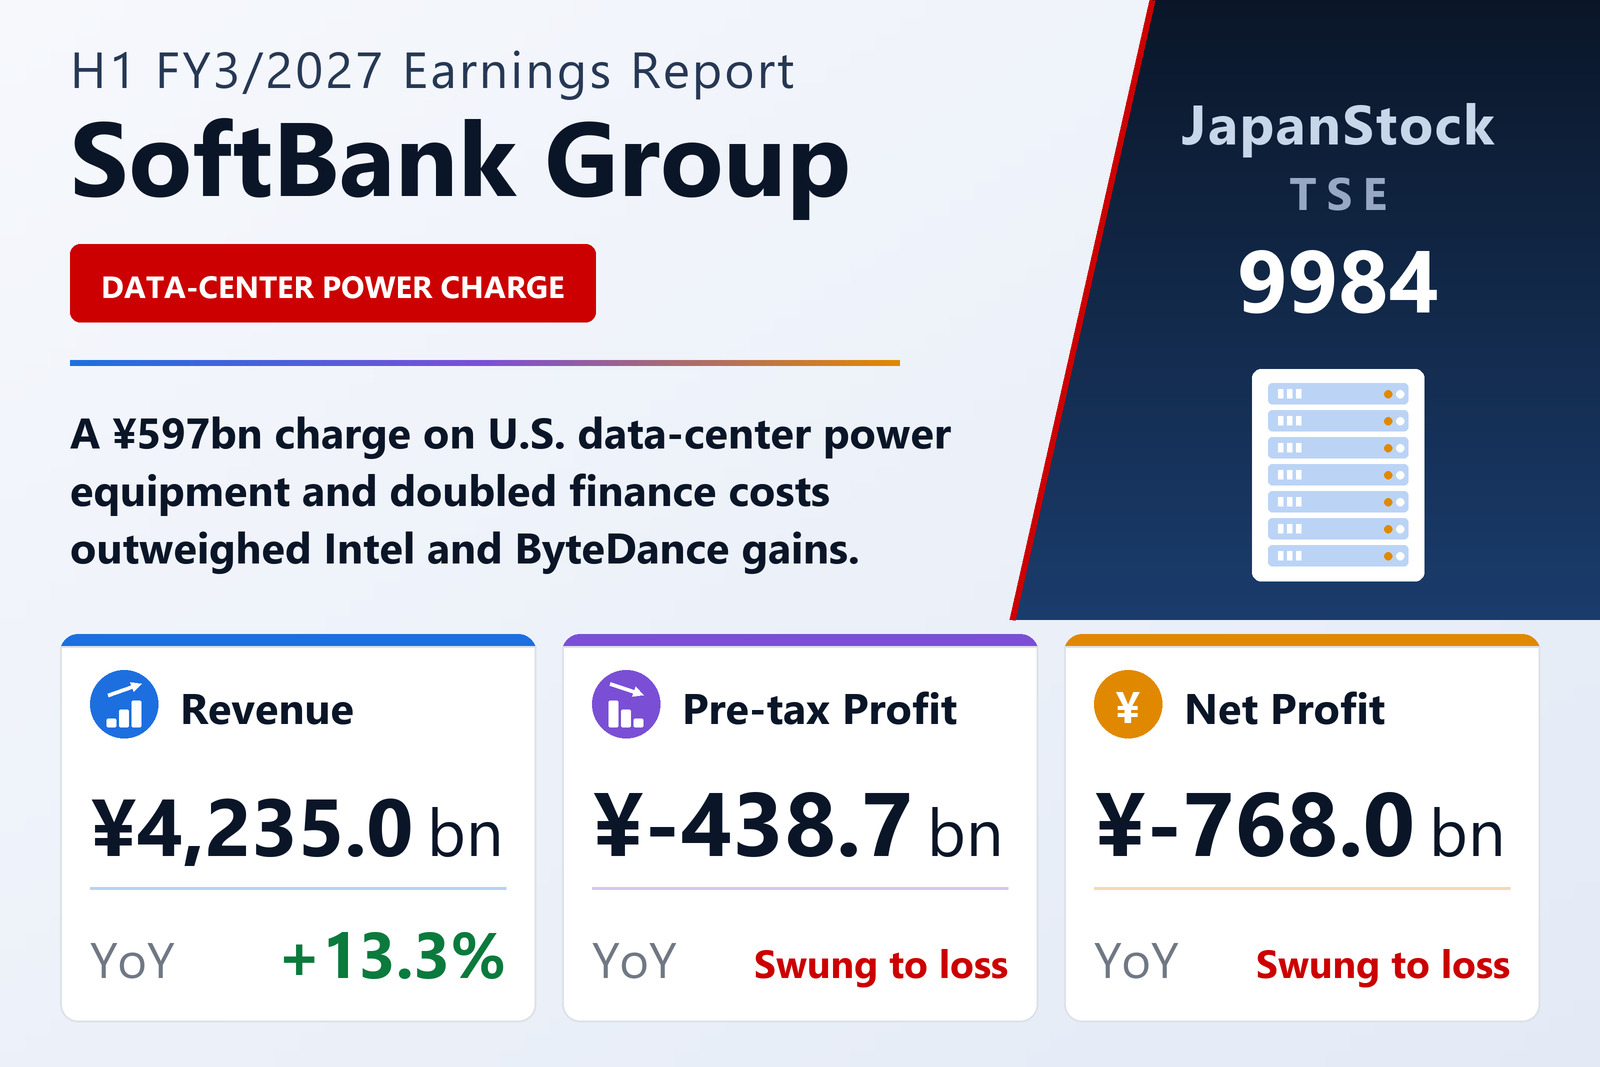
SoftBank Group Corp. (TSE: 9984) reported consolidated results under IFRS for the first half of FY3/2027, April 1 to September 30, 2026, on November 10, 2026. The Investment Business of Holding Companies made ¥1,078,337 million, mainly ¥1,062,815 million on its Intel shares, and the SoftBank Vision Funds made ¥705,617 million: SVF1 gained ¥381,101 million as a $3.6 billion rise in the value of ByteDance outweighed lower share prices at Coupang and others, and SVF2 gained ¥372,854 million. SoftBank booked no gain or loss on OpenAI in the half.
Silver Bands 7 (SB7), a subsidiary building power infrastructure for U.S. AI data-center projects including a campus in Pike County, Ohio, revised its equipment procurement plan, leading to a ¥597,248 million loss: ¥457,030 million on non-refundable advances and ¥140,218 million on contract changes and settlements. Selling, general and administrative expenses rose 46.5% to ¥2,368,790 million as Arm, Graphcore and the newly consolidated Ampere added staff, finance costs more than doubled to ¥790,662 million after margin and bridge loans, and derivative losses of ¥433,293 million included ¥321,891 million on a forward sale of its Intel stake.
OpenAI stake completed, DigitalBridge acquired
SoftBank completed its additional $30 billion investment in OpenAI in October through SVF2, taking its cumulative investment to $64.6 billion and its stake to about 13%. On September 30 it acquired DigitalBridge Group, a digital-infrastructure asset manager, for $3.1 billion, adding 308 companies to the group. Total assets rose 14.2% to ¥69,387,194 million, while the equity ratio fell to 23.6% from 29.0%. SoftBank does not issue earnings guidance; it paid an interim dividend of ¥5.50 and plans ¥5.50 at year-end, for ¥11 on a split-adjusted basis, unchanged.
| Metric | H1 FY3/2027 | H1 FY3/2026 | Change |
|---|---|---|---|
| Revenue (¥ million) | 4,235,037 | 3,736,843 | +13.3% |
| Total gain on investments (¥ million) | 1,725,796 | 3,926,665 | -56.0% |
| of which Investment Business of Holding Companies (¥ million) | 1,078,337 | 363,998 | +196.2% |
| of which SoftBank Vision Funds (¥ million) | 705,617 | 3,415,482 | -79.3% |
| SG&A expenses (¥ million) | 2,368,790 | 1,616,855 | +46.5% |
| Finance cost (¥ million) | 790,662 | 340,018 | +132.5% |
| Pre-tax profit (¥ million) | -438,705 | 3,686,382 | profit to loss |
| Net profit attrib. to owners of parent (¥ million) | -768,007 | 2,924,066 | profit to loss |
| Comprehensive income (¥ million) | -1,009,002 | 3,239,811 | profit to loss |
| EPS (¥) | -136.47 | 510.37 | profit to loss |
| Total assets (¥ million) | 69,387,194 | 60,749,547 | +14.2% |
| Equity attrib. to owners of parent (¥ million) | 16,396,610 | 17,621,823 | -7.0% |
| Equity ratio | 23.6% | 29.0% | -5.4 pt |
JapanStockPulse provides informational content only and does not constitute investment advice. Figures are taken from the company's published earnings short report and may be subject to subsequent revision.