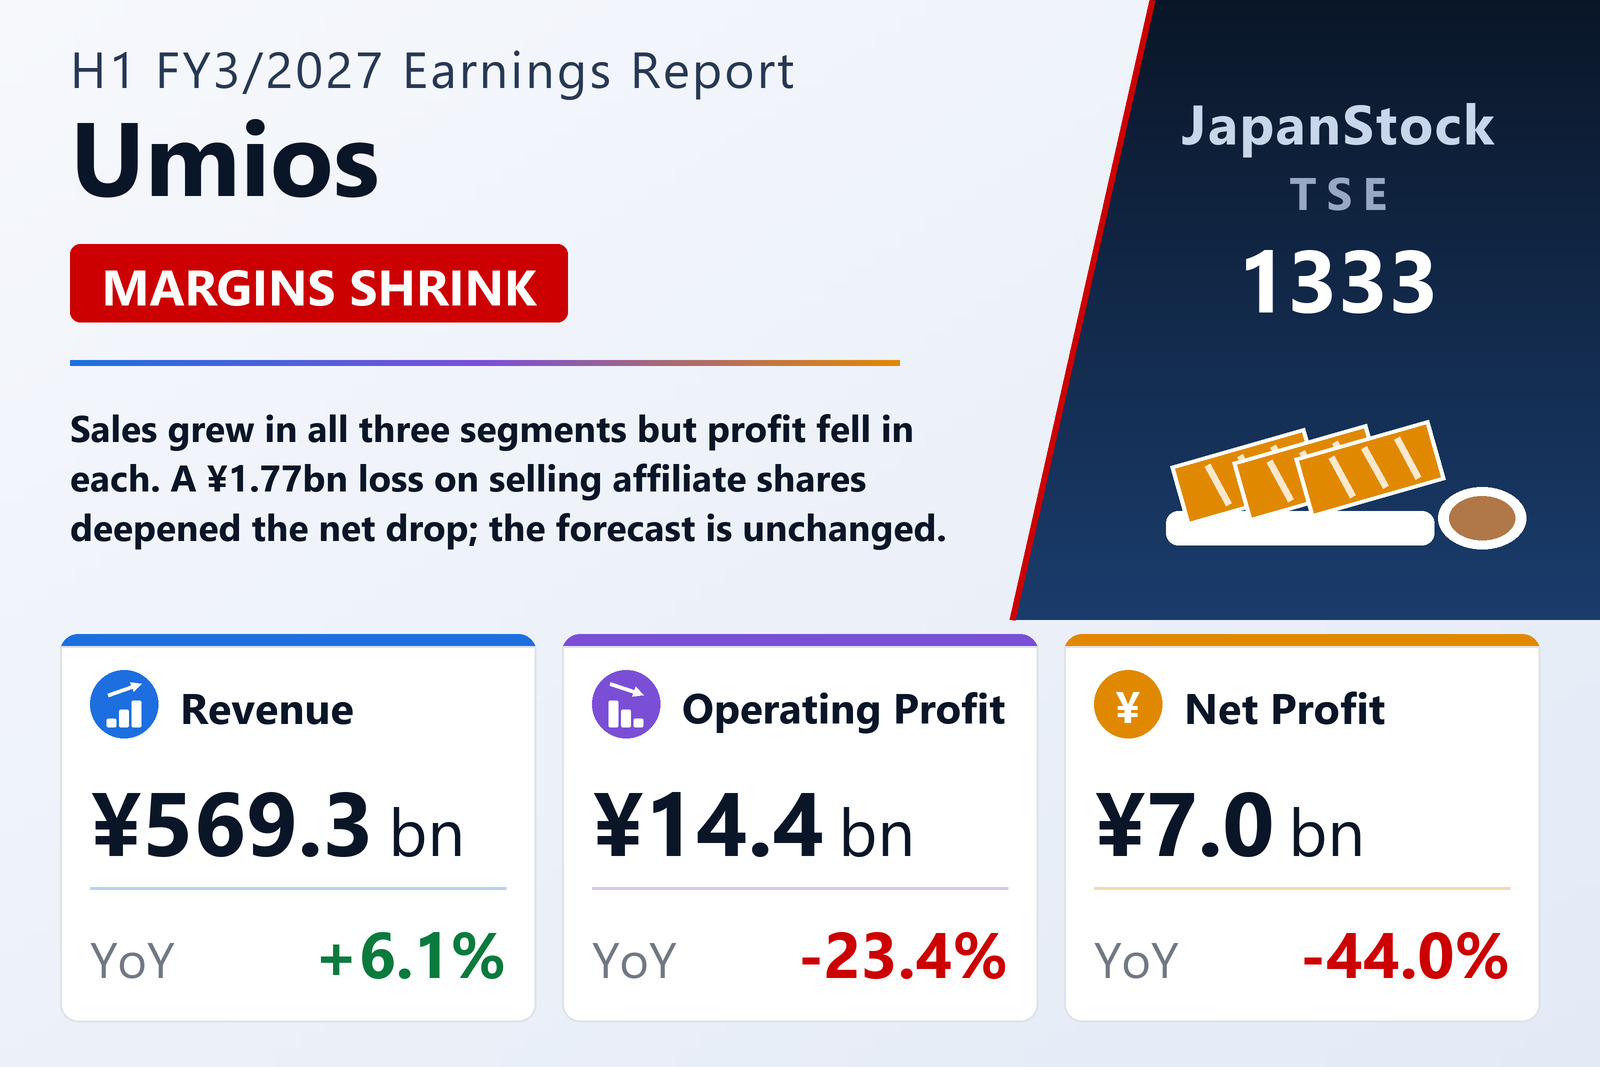
Sales up, segment profit down across the board
Umios Corporation (TSE: 1333) reported consolidated results under Japanese GAAP for the first half of FY3/2027, April 1 to September 30, 2026, on November 9, 2026. From this year it regrouped its business units, chiefly to concentrate sales functions, and the prior-year segment figures below are on the new basis. Marine Resources sales rose 15.7% to ¥64,382 million, but segment profit halved to ¥639 million from ¥1,254 million. Food Distribution, the largest segment, grew sales 5.8% to ¥398,481 million while profit fell 22.4% to ¥6,938 million, and Processed Foods sales rose 2.1% to ¥95,924 million as profit fell 37.4% to ¥4,683 million.
Ordinary profit fell 22.3% to ¥14,237 million. The drop in net profit was steeper because the year-earlier half included a ¥3,800 million gain on the sale of investment securities, while this half booked a ¥1,773 million loss on the sale of shares in an affiliate. Earnings per share were ¥46.43 against ¥82.41, adjusted for the three-for-one stock split of January 1, 2026. Ten companies, including Pet World International Sdn. Bhd., entered the consolidation, and two, including Umios Logi, left it.
Forecast kept; dividend ¥45
Umios kept its FY3/2027 forecast of net sales of ¥1,110,000 million (+0.4%), operating profit of ¥32,000 million (+2.6%), ordinary profit of ¥30,000 million (-4.0%) and net profit attributable to owners of ¥15,000 million (-32.4%). It plans an annual dividend of ¥45, an interim ¥22 and a year-end ¥23, against a split-adjusted ¥44.67 for FY3/2026. Total assets rose to ¥761,078 million and the equity ratio was 32.7%.
| Metric | H1 FY3/2027 | H1 FY3/2026 | Change |
|---|---|---|---|
| Revenue (¥ million) | 569,271 | 536,697 | +6.1% |
| Operating profit (¥ million) | 14,363 | 18,740 | -23.4% |
| Ordinary profit (¥ million) | 14,237 | 18,332 | -22.3% |
| Net profit attrib. to owners of parent (¥ million) | 6,978 | 12,455 | -44.0% |
| EPS (¥) | 46.43 | 82.41 | -43.7% |
| Comprehensive income (¥ million) | 11,658 | 12,040 | -3.2% |
| Marine Resources — revenue (¥ million) | 64,382 | 55,631 | +15.7% |
| Marine Resources — segment profit (¥ million) | 639 | 1,254 | -49.0% |
| Food Distribution — revenue (¥ million) | 398,481 | 376,680 | +5.8% |
| Food Distribution — segment profit (¥ million) | 6,938 | 8,942 | -22.4% |
| Processed Foods — revenue (¥ million) | 95,924 | 93,940 | +2.1% |
| Processed Foods — segment profit (¥ million) | 4,683 | 7,484 | -37.4% |
| Total assets (¥ million) | 761,078 | 751,702 | +1.2% |
| Net assets (¥ million) | 294,749 | 291,487 | +1.1% |
| Equity ratio | 32.7% | 32.9% | -0.2 pt |
| FY3/2027 guidance — revenue (¥ million) | 1,110,000 | — | +0.4% |
| FY3/2027 guidance — operating profit (¥ million) | 32,000 | — | +2.6% |
| FY3/2027 guidance — ordinary profit (¥ million) | 30,000 | — | -4.0% |
| FY3/2027 guidance — net profit (¥ million) | 15,000 | — | -32.4% |
| Annual dividend per share (¥) | 45.00 | 44.67 | +0.7% |
JapanStockPulse provides informational content only and does not constitute investment advice. Figures are taken from the company's published earnings short report and may be subject to subsequent revision.