Both segments grow sharply
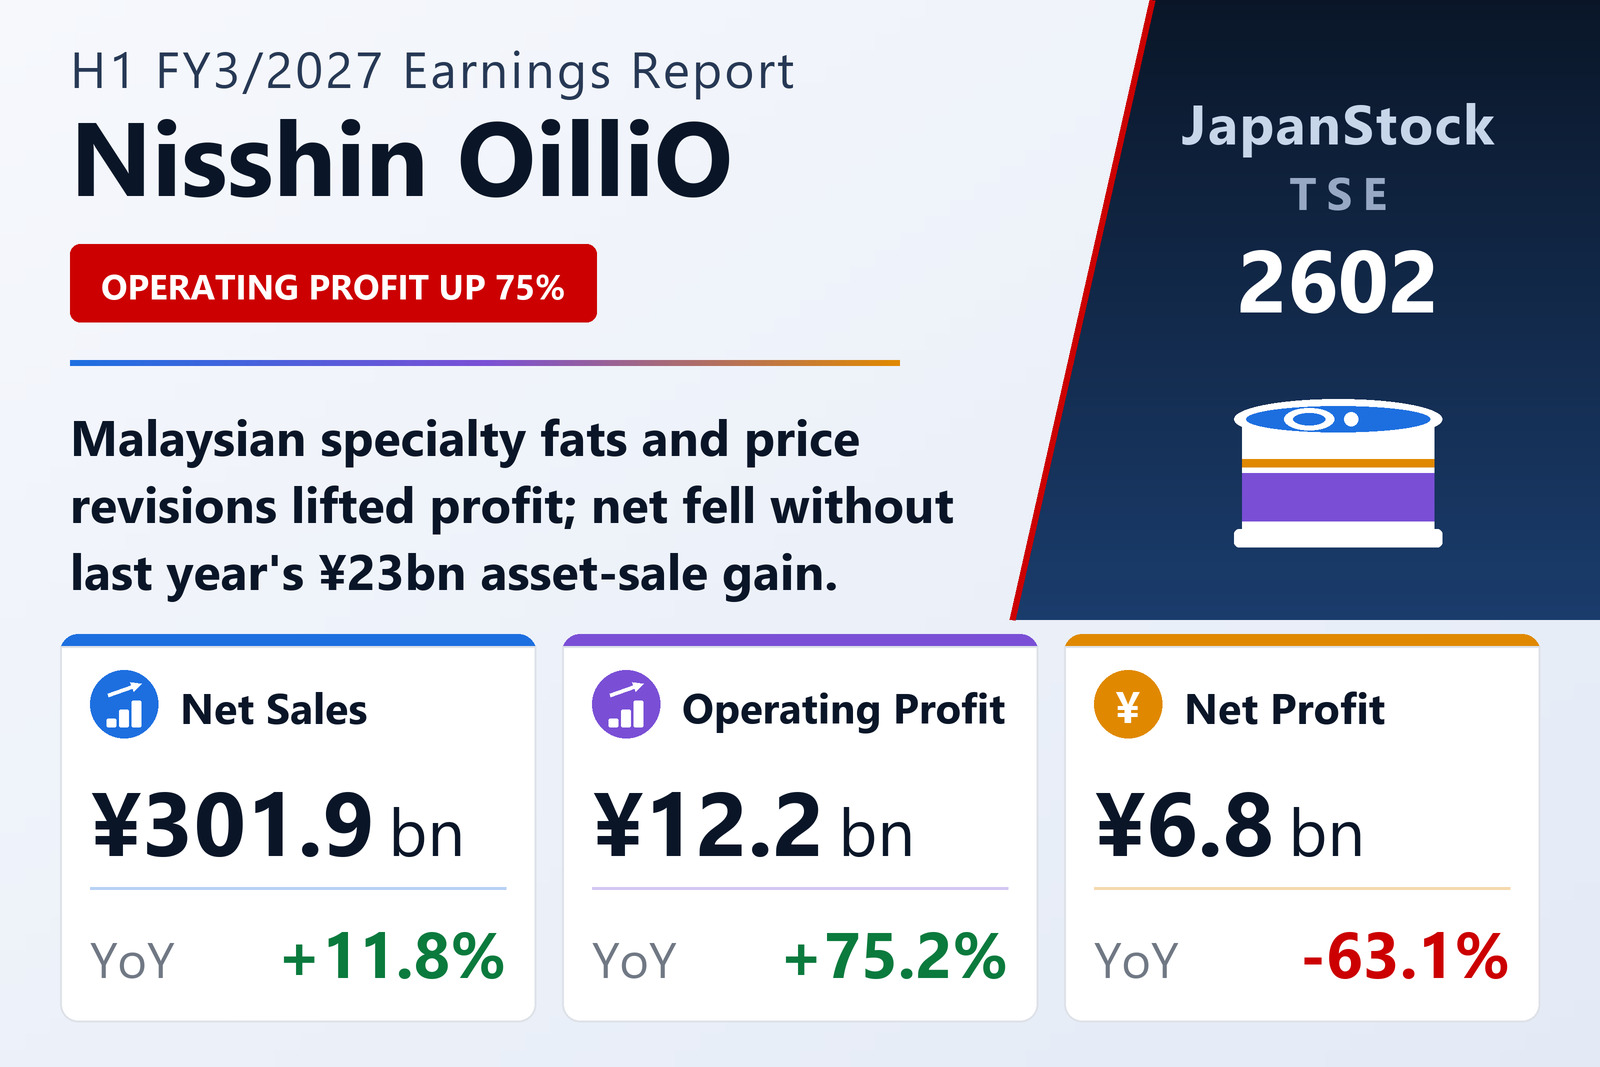
The Nisshin OilliO Group, Ltd. (TSE: 2602) reported consolidated results for the first half of FY3/2027, April 1 to September 30, 2026, on November 9, 2026. Global Oils & Processed Fats sales rose 23.6% to ¥81,036 million and operating profit 183.6% to ¥4,105 million, as Malaysia's Intercontinental Specialty Fats sold more at higher prices, helped by currency translation and mark-to-market gains on palm oil contracts. Oils, Meal & Processed Foods sales rose 8.1% to ¥206,946 million and operating profit 51.4% to ¥7,331 million; within it, edible oils and meal raised operating profit 108.5% to ¥5,794 million.
Commercial and industrial oil sales rose on higher volumes of basic products and price revisions to pass on costs. In home use, linseed, rice-bran and sesame oils sold well, but cooking-oil volumes fell after price rises; higher unit prices still lifted sales. Lower olive-oil costs offset higher oil, logistics and energy costs, while soybean and rapeseed meal prices rose with Chicago soybean meal futures and the weak yen. Total assets were ¥452,541 million and the equity ratio 46.9%.
Guidance and dividend unchanged
Nisshin OilliO kept its FY3/2027 forecast of net sales of ¥590,000 million (+6.4%), operating profit of ¥19,000 million (+11.6%), ordinary profit of ¥18,000 million (+12.3%) and net profit attributable to owners of ¥12,000 million (-50.0%). After a three-for-one stock split on April 1, 2026, it paid an interim dividend of ¥30 and plans ¥60 for the year, equivalent to the ¥180 paid for FY3/2026 before the split.
| Metric | H1 FY3/2027 | H1 FY3/2026 | Change |
|---|---|---|---|
| Net sales (¥ million) | 301,889 | 269,921 | +11.8% |
| Operating profit (¥ million) | 12,216 | 6,972 | +75.2% |
| Ordinary profit (¥ million) | 10,097 | 5,971 | +69.1% |
| Net profit attrib. to owners of parent (¥ million) | 6,832 | 18,508 | -63.1% |
| Comprehensive income (¥ million) | 4,526 | 22,461 | -79.8% |
| EPS (¥) | 74.67 | 192.88 | -61.3% |
| Global Oils & Processed Fats — revenue (¥ million) | 81,036 | 65,566 | +23.6% |
| Global Oils & Processed Fats — segment profit (¥ million) | 4,105 | 1,447 | +183.6% |
| Oils, Meal & Processed Foods — revenue (¥ million) | 206,946 | 191,520 | +8.1% |
| Oils, Meal & Processed Foods — segment profit (¥ million) | 7,331 | 4,841 | +51.4% |
| Total assets (¥ million) | 452,541 | 451,185 | +0.3% |
| Net assets (¥ million) | 223,777 | 222,004 | +0.8% |
| Equity ratio | 46.9% | 46.6% | +0.3 pt |
| FY3/2027 guidance — revenue (¥ million) | 590,000 | — | +6.4% |
| FY3/2027 guidance — operating profit (¥ million) | 19,000 | — | +11.6% |
| FY3/2027 guidance — ordinary profit (¥ million) | 18,000 | — | +12.3% |
| FY3/2027 guidance — net profit (¥ million) | 12,000 | — | -50.0% |
| Annual dividend per share (¥) | 60.00 | 60.00 | unchanged |
JapanStockPulse provides informational content only and does not constitute investment advice. Figures are taken from the company's published earnings short report and may be subject to subsequent revision.