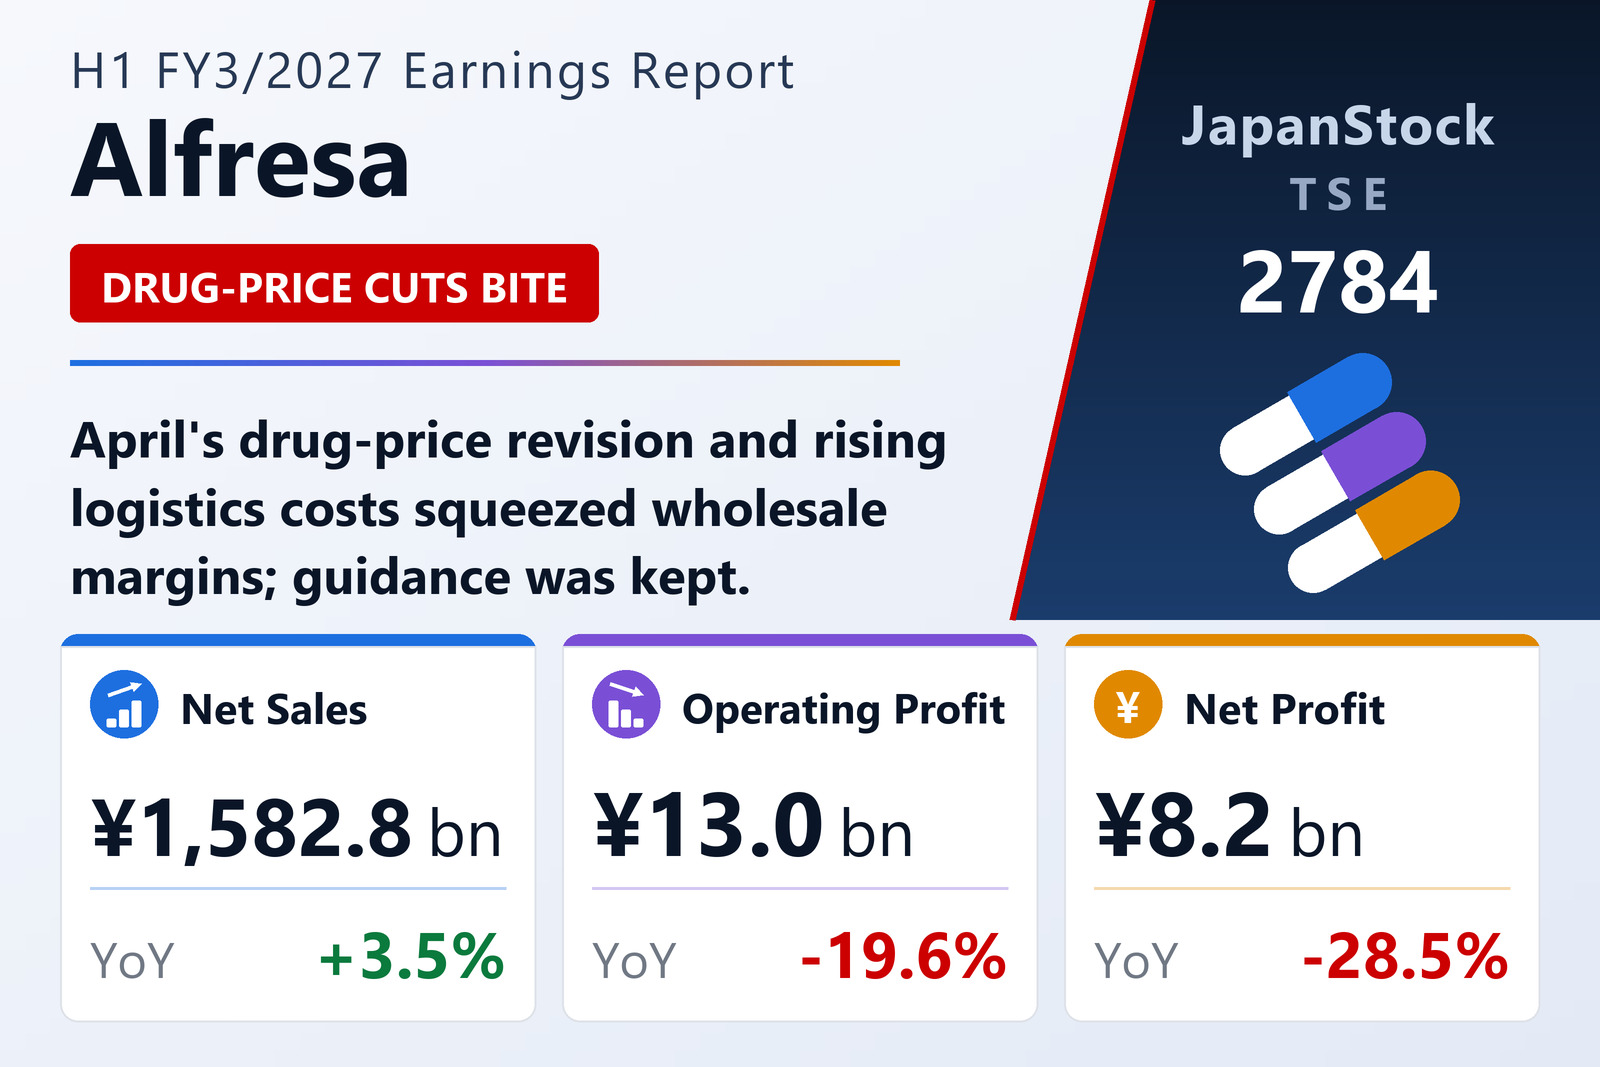
Wholesale margin squeezed
Alfresa Holdings Corporation (TSE: 2784) reported consolidated results for the first half of FY3/2027, April 1 to September 30, 2026, on November 9, 2026. Ethical Pharmaceuticals Wholesale sales rose 4.2% to ¥1,425,124 million on higher sales of some type 2 diabetes drugs and specialty medicines, but operating profit fell 5.2% to ¥13,986 million because of the April drug-price revision, its work to eliminate uneven price gaps under revised distribution guidelines, and rising logistics and personnel costs. Self-Medication Wholesale sales fell 3.7% to ¥130,582 million and operating profit 41.6% to ¥1,025 million amid consolidation among large drugstore chains and higher logistics costs.
Alfresa bought back ¥14,999 million of its own shares in May 2026, agreed to acquire ear, nose and throat device maker Nagashima Medical Instruments, made an additional investment in regenerative-medicine venture ReeNT, and started operations at a new drug-manufacturing building at Alfresa Pharma's Gunma plant in April. Net assets fell 2.6% to ¥494,734 million after the buyback, and the equity ratio slipped to 32.2%.
Guidance unchanged
Alfresa kept its FY3/2027 forecast of net sales of ¥3,144,000 million (+1.3%), operating profit of ¥33,900 million (-6.3%), ordinary profit of ¥36,600 million (-5.3%) and net profit attributable to owners of ¥20,800 million (-50.2%). It paid an interim dividend of ¥35 and kept its annual forecast of ¥71, up from ¥68.
| Metric | H1 FY3/2027 | H1 FY3/2026 | Change |
|---|---|---|---|
| Net sales (¥ million) | 1,582,760 | 1,529,762 | +3.5% |
| Operating profit (¥ million) | 13,029 | 16,207 | -19.6% |
| Ordinary profit (¥ million) | 14,380 | 17,485 | -17.8% |
| Net profit attrib. to owners of parent (¥ million) | 8,240 | 11,521 | -28.5% |
| Comprehensive income (¥ million) | 9,385 | 13,542 | -30.7% |
| EPS (¥) | 46.53 | 63.35 | -26.6% |
| Ethical Pharmaceuticals Wholesale — revenue (¥ million) | 1,425,124 | — | +4.2% |
| Ethical Pharmaceuticals Wholesale — segment profit (¥ million) | 13,986 | — | -5.2% |
| Self-Medication Wholesale — revenue (¥ million) | 130,582 | — | -3.7% |
| Self-Medication Wholesale — segment profit (¥ million) | 1,025 | — | -41.6% |
| Total assets (¥ million) | 1,536,401 | 1,507,016 | +2.0% |
| Net assets (¥ million) | 494,734 | 507,903 | -2.6% |
| Equity ratio | 32.2% | 33.7% | -1.5 pt |
| FY3/2027 guidance — revenue (¥ million) | 3,144,000 | — | +1.3% |
| FY3/2027 guidance — operating profit (¥ million) | 33,900 | — | -6.3% |
| FY3/2027 guidance — ordinary profit (¥ million) | 36,600 | — | -5.3% |
| FY3/2027 guidance — net profit (¥ million) | 20,800 | — | -50.2% |
| Annual dividend per share (¥) | 71.00 | 68.00 | +4.4% |
JapanStockPulse provides informational content only and does not constitute investment advice. Figures are taken from the company's published earnings short report and may be subject to subsequent revision.