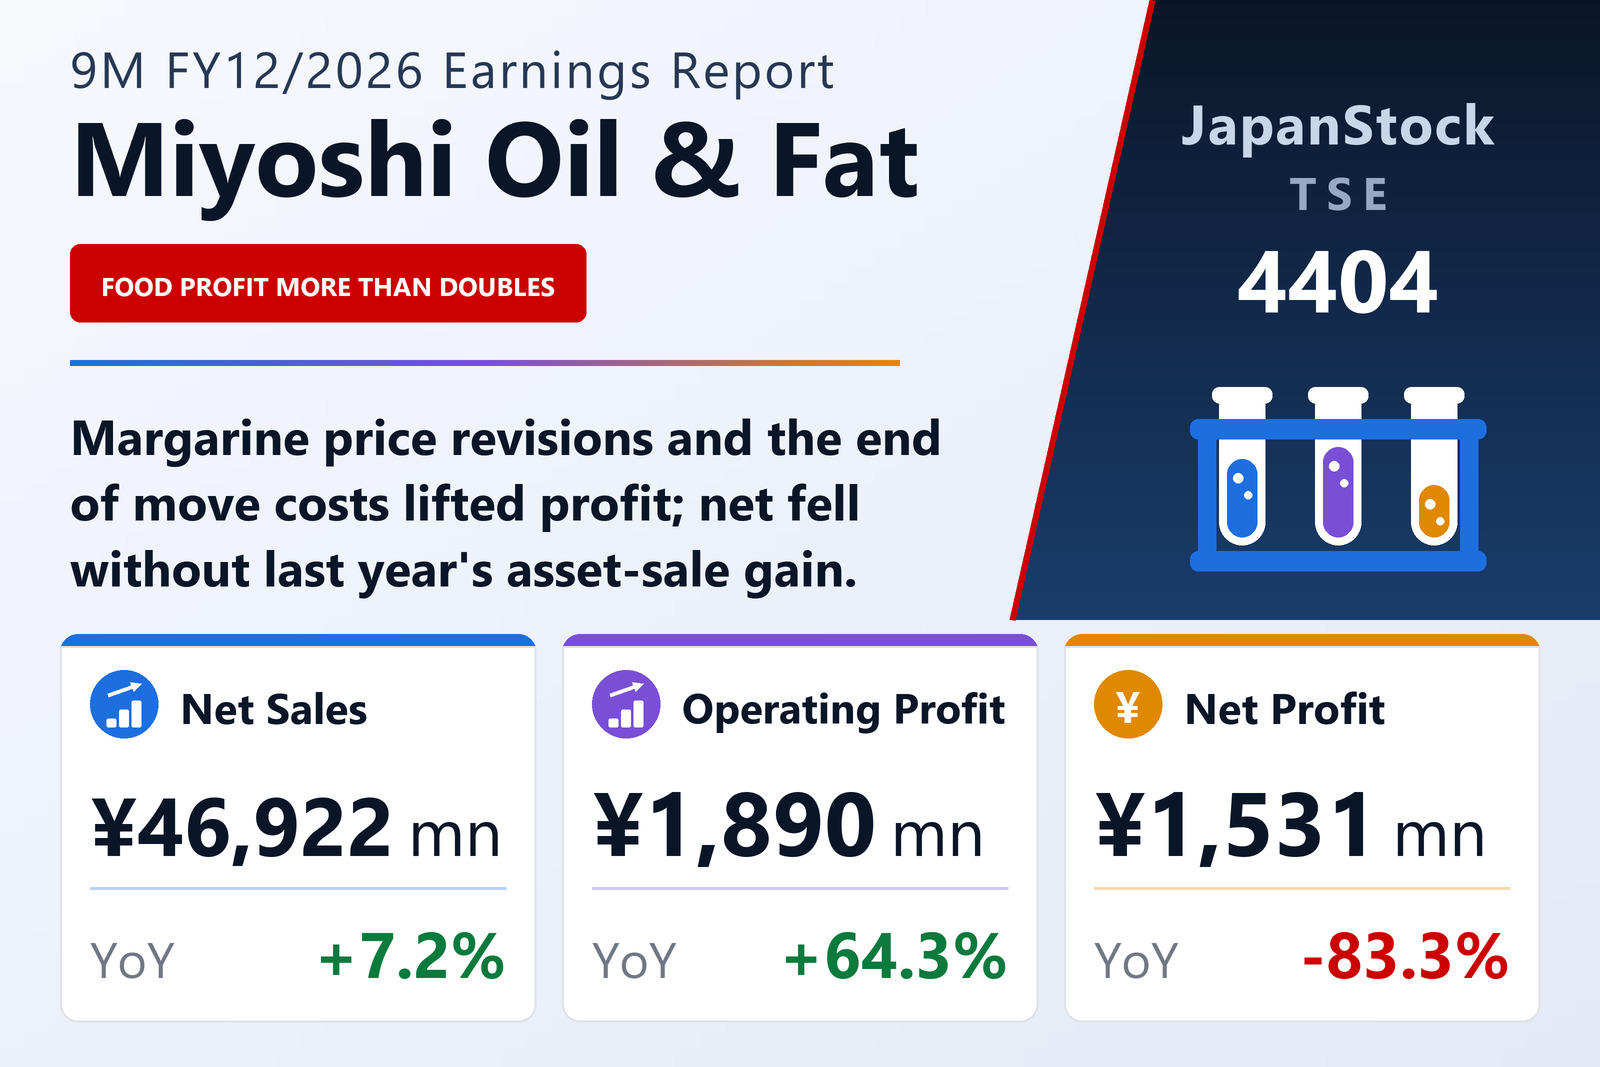
Food profit more than doubles
Miyoshi Oil & Fat Co., Ltd. (TSE: 4404) reported consolidated results for the first nine months of FY12/2026, January 1 to September 30, 2026, on November 9, 2026. Fat and oil raw-material prices stayed high on demand linked to biofuel policies, while the weak yen and the Middle East situation raised procurement costs. Food sales rose 5.5% to ¥32,719 million and segment profit 138.4% to ¥1,526 million, as it pushed main products such as margarine, shortening and powdered fats, sold products using its own flavour technology and substitutes for scarce cocoa, pruned its product line and raised prices to cover higher material and packaging costs.
Oleochemicals sales rose 10.9% to ¥13,861 million and segment profit 3.7% to ¥293 million: raw-material prices ran well above initial assumptions and domestic manufacturing demand was weak, but it priced to reflect costs; cleansing and face-wash bases sold well, while paper, pulp and environmental products faced cheap imports. The absence of last year's one-off head-office relocation costs also helped profit. Total assets rose 4.0% to ¥87,513 million and the equity ratio was 50.7%.
Guidance unchanged
Miyoshi kept its FY12/2026 forecast of net sales of ¥62,200 million (+4.6%), operating profit of ¥2,540 million (+29.6%), ordinary profit of ¥2,300 million (+20.2%) and net profit attributable to owners of ¥1,490 million (-84.5%), and its year-end dividend forecast of ¥70. The FY12/2025 dividend of ¥100 included a ¥30 special dividend.
| Metric | 9M FY12/2026 | 9M FY12/2025 | Change |
|---|---|---|---|
| Net sales (¥ million) | 46,922 | 43,760 | +7.2% |
| Operating profit (¥ million) | 1,890 | 1,150 | +64.3% |
| Ordinary profit (¥ million) | 1,761 | 1,129 | +55.9% |
| Net profit attrib. to owners of parent (¥ million) | 1,531 | 9,152 | -83.3% |
| Comprehensive income (¥ million) | 2,961 | 10,085 | -70.6% |
| EPS (¥) | 150.36 | 897.75 | -83.3% |
| Food — revenue (¥ million) | 32,719 | — | +5.5% |
| Food — segment profit (¥ million) | 1,526 | — | +138.4% |
| Oleochemicals — revenue (¥ million) | 13,861 | — | +10.9% |
| Oleochemicals — segment profit (¥ million) | 293 | — | +3.7% |
| Total assets (¥ million) | 87,513 | 84,160 | +4.0% |
| Net assets (¥ million) | 44,388 | 42,672 | +4.0% |
| Equity ratio | 50.7% | 50.6% | +0.1 pt |
| FY12/2026 guidance — revenue (¥ million) | 62,200 | — | +4.6% |
| FY12/2026 guidance — operating profit (¥ million) | 2,540 | — | +29.6% |
| FY12/2026 guidance — ordinary profit (¥ million) | 2,300 | — | +20.2% |
| FY12/2026 guidance — net profit (¥ million) | 1,490 | — | -84.5% |
| Annual dividend per share (¥) | 70.00 | 100.00 | -30.0% |
JapanStockPulse provides informational content only and does not constitute investment advice. Figures are taken from the company's published earnings short report and may be subject to subsequent revision.