Every segment grows
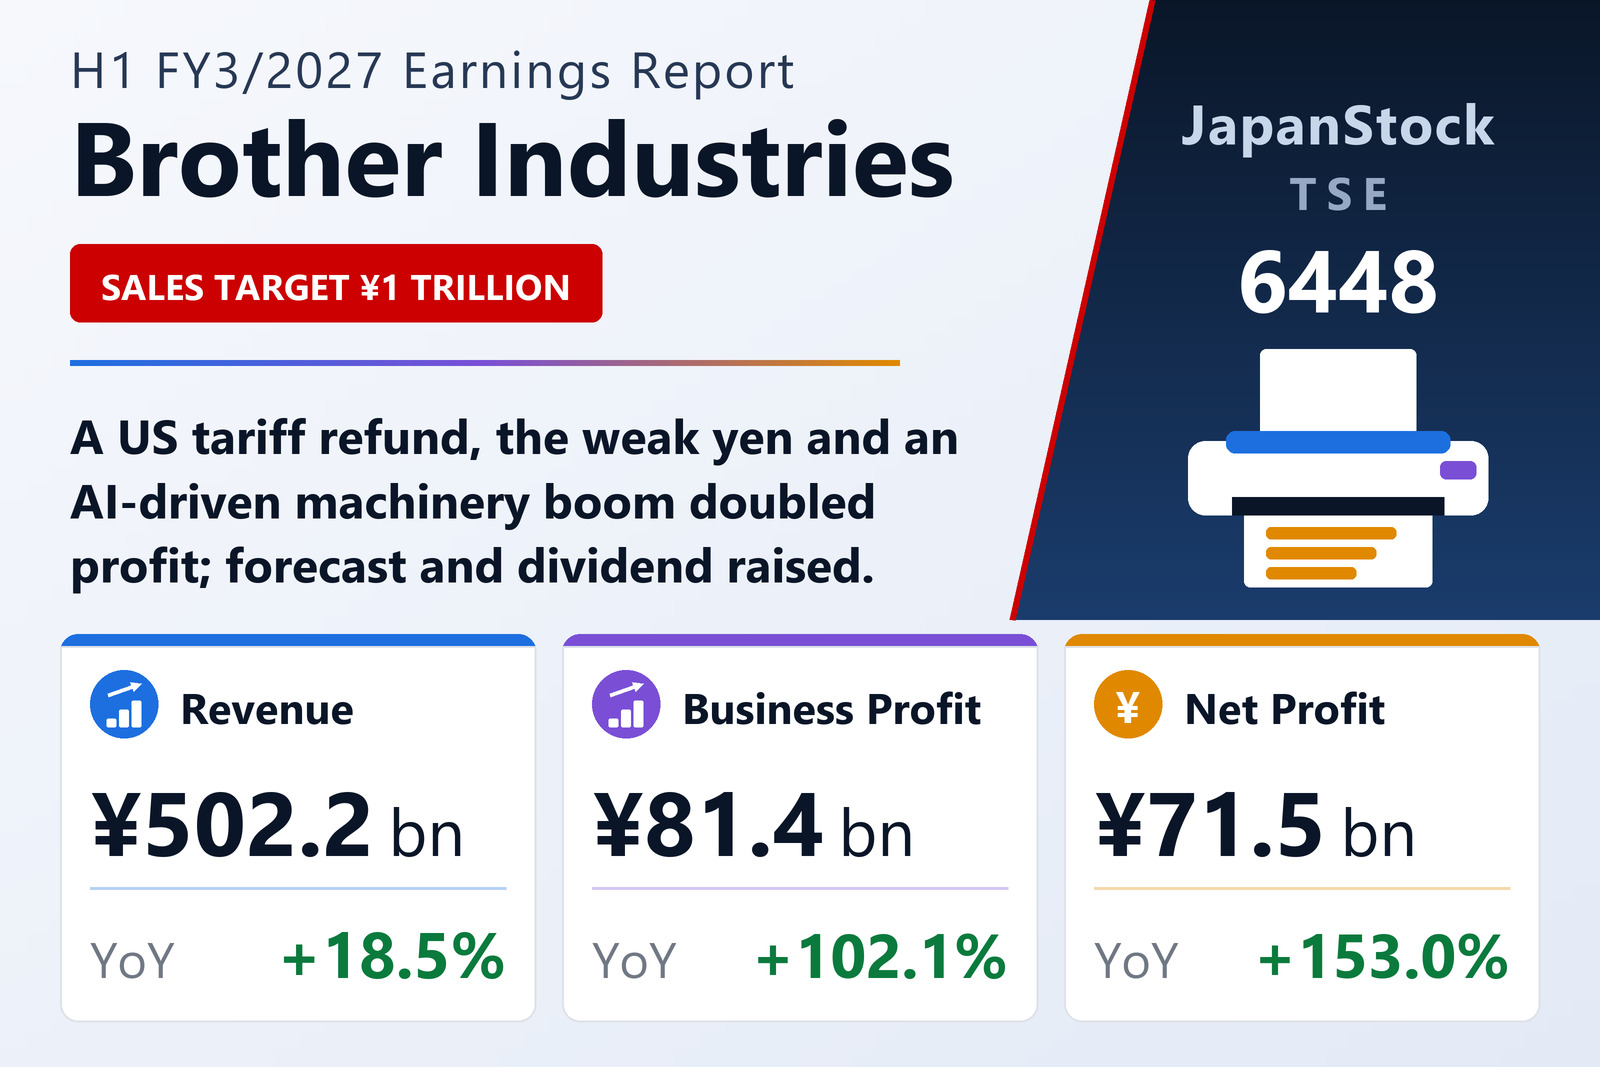
Brother Industries, Ltd. (TSE: 6448) reported consolidated IFRS results for the first half of FY3/2027, April 1 to September 30, 2026, on November 9, 2026. Its Network & Content business is classified as discontinued after it sold 70% of karaoke company Xing to U-NEXT HOLDINGS on April 1, 2026; the gain on that sale lifted net profit. Printing & Solutions revenue rose 14.9% to ¥311.2 billion and segment profit 87.2% to ¥61.8 billion on solid sales of devices and consumables, price measures, the tariff refund and the weak yen, as markets in Europe and China stayed soft. Industrial Printing revenue rose 27.9% to ¥85.2 billion and profit 324.9% to ¥5.5 billion after MUTOH became a subsidiary and Domino sold well.
Machinery revenue rose 42.9% to ¥54.9 billion and profit 163.5% to ¥8.0 billion as semiconductor and data-centre investment driven by AI lifted demand for industrial equipment, especially in China and Asia, while industrial sewing machines were weak. Nissei revenue rose 15.8% to ¥12.2 billion and Personal & Home revenue 14.8% to ¥31.3 billion. The dollar averaged ¥160.02 against ¥146.57 a year earlier. The equity ratio rose to 76.7%.
Forecast and dividend raised
Brother raised its FY3/2027 forecast: revenue to ¥1,000,000 million (+11.9%) from ¥980,000 million, business segment profit and operating profit to ¥105,000 million each from ¥90,000 million, pre-tax profit to ¥110,000 million from ¥94,500 million, and profit attributable to owners to ¥88,000 million (+30.1%). It raised its dividend forecast, paying an interim dividend of ¥60 and planning ¥120 for the year, up from ¥100.
| Metric | H1 FY3/2027 | H1 FY3/2026 | Change |
|---|---|---|---|
| Revenue (¥ million) | 502,163 | 423,698 | +18.5% |
| Business profit (¥ million) | 81,383 | 40,260 | +102.1% |
| Operating profit (¥ million) | 81,950 | 38,138 | +114.9% |
| Pre-tax profit (¥ million) | 85,474 | 39,905 | +114.2% |
| Net profit attrib. to owners of parent (¥ million) | 71,523 | 28,271 | +153.0% |
| Comprehensive income (¥ million) | 64,155 | 39,013 | +64.4% |
| EPS (¥) | 289.09 | 111.30 | +159.7% |
| Total assets (¥ million) | 1,049,252 | 1,018,815 | +3.0% |
| Equity attrib. to owners of parent (¥ million) | 804,580 | 763,277 | +5.4% |
| Equity ratio | 76.7% | 74.9% | +1.8 pt |
| FY3/2027 guidance — revenue (¥ million) | 1,000,000 | — | +11.9% |
| FY3/2027 guidance — business profit (¥ million) | 105,000 | — | +25.6% |
| FY3/2027 guidance — operating profit (¥ million) | 105,000 | — | +34.8% |
| FY3/2027 guidance — net profit (¥ million) | 88,000 | — | +30.1% |
| Annual dividend per share (¥) | 120.00 | 100.00 | +20.0% |
JapanStockPulse provides informational content only and does not constitute investment advice. Figures are taken from the company's published earnings short report and may be subject to subsequent revision.