Higher volumes, lower metal prices
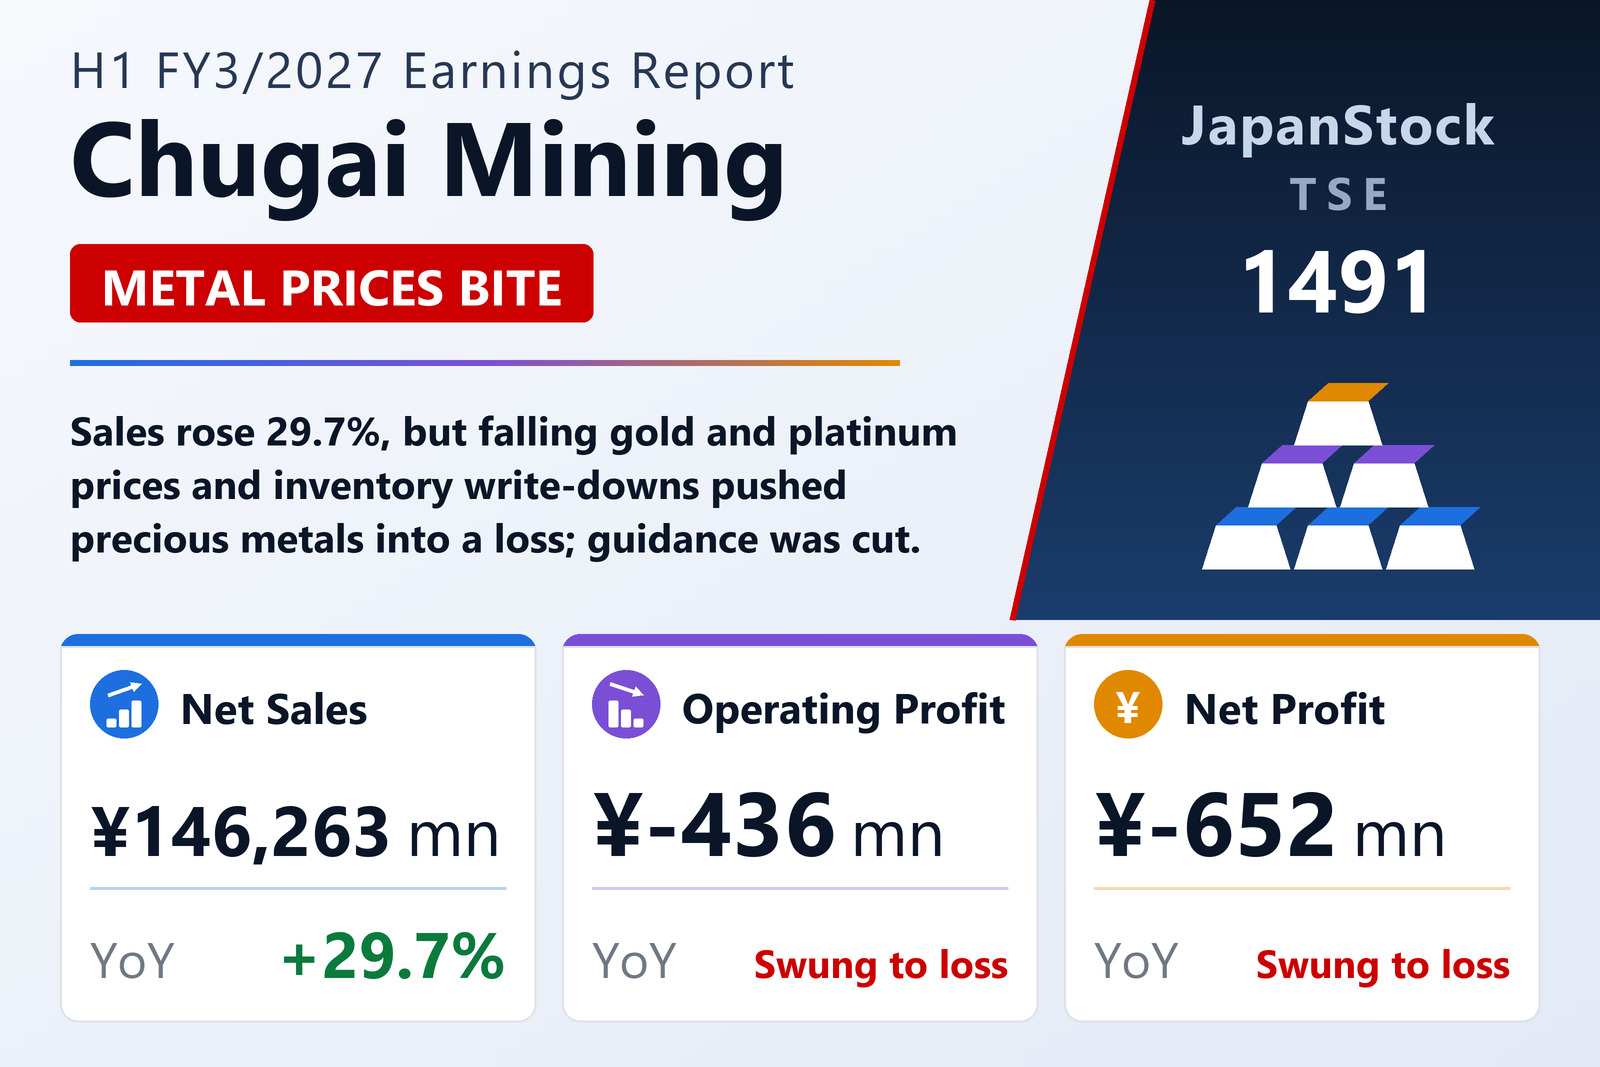
Chugai Mining Co., Ltd. (TSE: 1491), a precious-metals trader that also deals in used machine tools and character merchandise, reported consolidated results for the first half of FY3/2027, April 1 to September 30, 2026, on November 12, 2026 under Japanese GAAP. Net sales rose 29.7% to ¥146,263.2 million, but the group swung to an operating loss of ¥435.5 million, an ordinary loss of ¥532.3 million and a net loss attributable to owners of ¥651.8 million, against a ¥718.8 million profit a year earlier. The company said gold and platinum prices trended lower as U.S. rate rises and a stronger dollar outweighed safe-haven demand, and that it booked inventory valuation losses.
Precious Metals, which accounts for almost all sales, grew revenue 30.2% to ¥144,568.5 million but swung to an operating loss of ¥140.5 million from a ¥915.9 million profit. Machinery, which sells used machine tools mainly to small and mid-sized manufacturers, lifted sales 8.2% to ¥416.0 million and operating profit to ¥16.5 million from ¥5.8 million despite weak capital spending by those customers. In Content, sales fell 8.2% to ¥1,254.0 million and operating profit dropped 90.2% to ¥16.0 million as event staffing and promotion costs rose and inventory was written down. Raw-material and product inventories rose sharply, total assets climbed to ¥20,121 million, and the equity ratio fell to 40.9% from 53.3%.
Full-year forecast cut to a loss
Chugai Mining revised the FY3/2027 forecast it had published on May 15, 2026, and now expects net sales of ¥278,000 million (−1.3%), operating profit of ¥200 million (−91.8%), ordinary profit of ¥30 million (−98.7%) and a net loss attributable to owners of ¥100 million. The year-end dividend for FY3/2027 has not yet been set; it paid ¥34 for FY3/2026. Per-share figures reflect the 1-for-20 reverse stock split of October 1, 2025.
| Metric | H1 FY3/2027 | H1 FY3/2026 | Change |
|---|---|---|---|
| Net sales (¥ million) | 146,263.2 | 112,748.6 | +29.7% |
| Operating profit (¥ million) | −435.5 | 798.1 | profit to loss |
| Ordinary profit (¥ million) | −532.3 | 722.0 | profit to loss |
| Net profit attrib. to owners of parent (¥ million) | −651.8 | 718.8 | profit to loss |
| EPS (¥) | −45.37 | 49.89 | profit to loss |
| Precious Metals — revenue (¥ million) | 144,568.5 | 110,997.6 | +30.2% |
| Precious Metals — segment profit (¥ million) | −140.5 | 915.9 | profit to loss |
| Machinery — revenue (¥ million) | 416.0 | 384.4 | +8.2% |
| Machinery — segment profit (¥ million) | 16.5 | 5.8 | +183.8% |
| Content — revenue (¥ million) | 1,254.0 | 1,366.6 | −8.2% |
| Content — segment profit (¥ million) | 16.0 | 164.3 | −90.2% |
| Total assets (¥ million) | 20,121 | 17,570 | +14.5% |
| Net assets (¥ million) | 8,221 | 9,366 | −12.2% |
| Equity ratio | 40.9% | 53.3% | −12.4 pt |
| FY3/2027 guidance — revenue (¥ million) | 278,000 | — | −1.3% |
| FY3/2027 guidance — operating profit (¥ million) | 200 | — | −91.8% |
| FY3/2027 guidance — ordinary profit (¥ million) | 30 | — | −98.7% |
| FY3/2027 guidance — net profit (¥ million) | −100 | — | profit to loss |
JapanStockPulse provides informational content only and does not constitute investment advice. Figures are taken from the company's published earnings short report and may be subject to subsequent revision.