From volume to quality in member acquisition
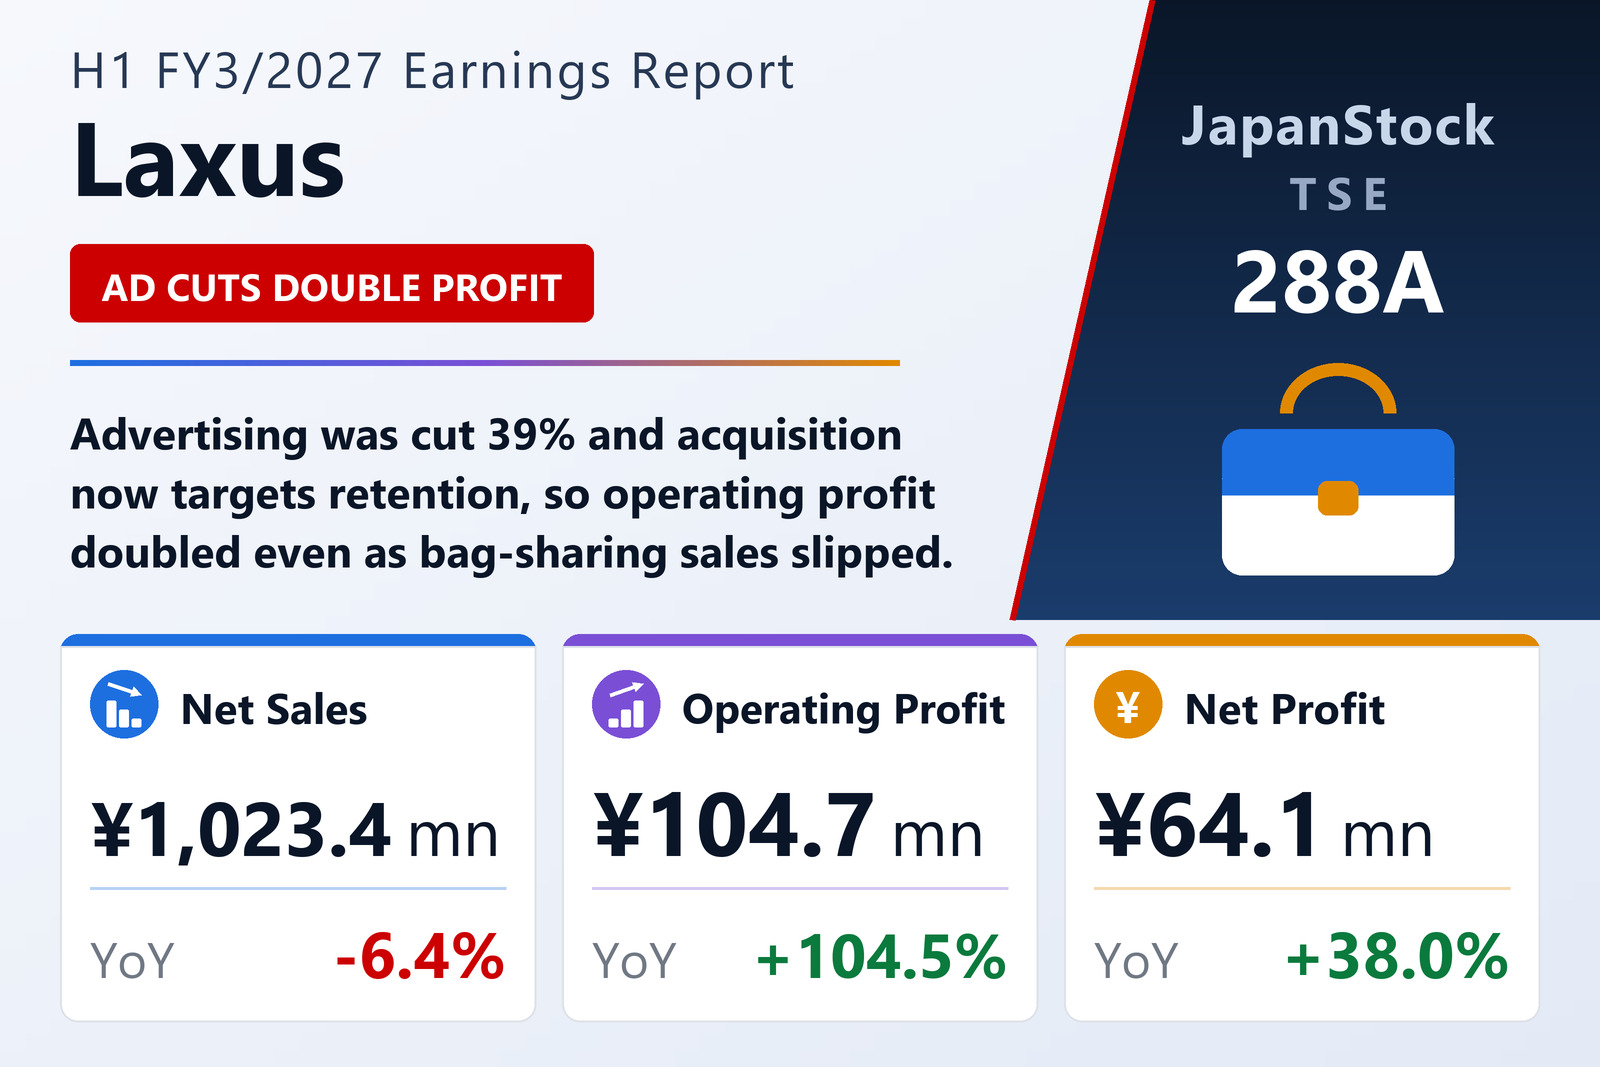
Laxus Technologies Inc. (TSE: 288A), which runs the subscription-based luxury handbag sharing service Laxus, reported non-consolidated results for the first half of FY3/2027, April 1 to September 30, 2026, on November 12, 2026 under Japanese GAAP. Net sales fell 6.4% to ¥1,023.4 million, and gross profit after adjustments fell 9.7% to ¥721.2 million as depreciation on a larger rental-bag inventory rose. Selling, general and administrative expenses fell by ¥130.7 million, led by advertising, which was cut 39.0% to ¥149.4 million, so operating profit rose 104.5% to ¥104.7 million and ordinary profit rose 58.2% to ¥90.9 million.
Cost per acquisition improved by 33%, but the company found that members signed up with large, uniform joining discounts cancelled early and spent less over their lifetime, so it stopped those discounts at the end of the second quarter and began setting offers bag by bag, judging acquisition by retention rather than cost. Contracts stood at 16,613, down 276 from a year earlier, and average revenue per user fell to ¥8,743 from ¥9,030. Bag sales, which shifted from low-margin B2B sales towards its try-before-you-buy service, its Omotesando store and outside e-commerce malls, came to 88% of the prior-year level. Laxus also launched an "ANA Luxury Bag" service at the end of July. Net profit rose 38.0% to ¥64.1 million, or ¥2.47 per share.
Guidance unchanged
Laxus kept the FY3/2027 forecast it published on May 14, 2026: net sales of ¥2,546 million (+11.6%), operating profit of ¥295 million (+59.5%), ordinary profit of ¥255 million (+34.3%) and net profit of ¥152 million (+55.1%). It plans no dividend. Total assets were ¥4,292 million and the equity ratio rose to 73.7% from 70.7%.
| Metric | H1 FY3/2027 | H1 FY3/2026 | Change |
|---|---|---|---|
| Net sales (¥ million) | 1,023.4 | 1,093.1 | −6.4% |
| Operating profit (¥ million) | 104.7 | 51.2 | +104.5% |
| Ordinary profit (¥ million) | 90.9 | 57.4 | +58.2% |
| Net profit (¥ million) | 64.1 | 46.4 | +38.0% |
| EPS (¥) | 2.47 | 1.81 | +36.5% |
| Total assets (¥ million) | 4,292 | 4,364 | −1.6% |
| Net assets (¥ million) | 3,162 | 3,085 | +2.5% |
| Equity ratio | 73.7% | 70.7% | +3.0 pt |
| FY3/2027 guidance — revenue (¥ million) | 2,546 | — | +11.6% |
| FY3/2027 guidance — operating profit (¥ million) | 295 | — | +59.5% |
| FY3/2027 guidance — ordinary profit (¥ million) | 255 | — | +34.3% |
| FY3/2027 guidance — net profit (¥ million) | 152 | — | +55.1% |
| Annual dividend per share (¥) | 0.00 | 0.00 | unchanged |
JapanStockPulse provides informational content only and does not constitute investment advice. Figures are taken from the company's published earnings short report and may be subject to subsequent revision.