Specialty drugs lift sales, costs squeeze margins
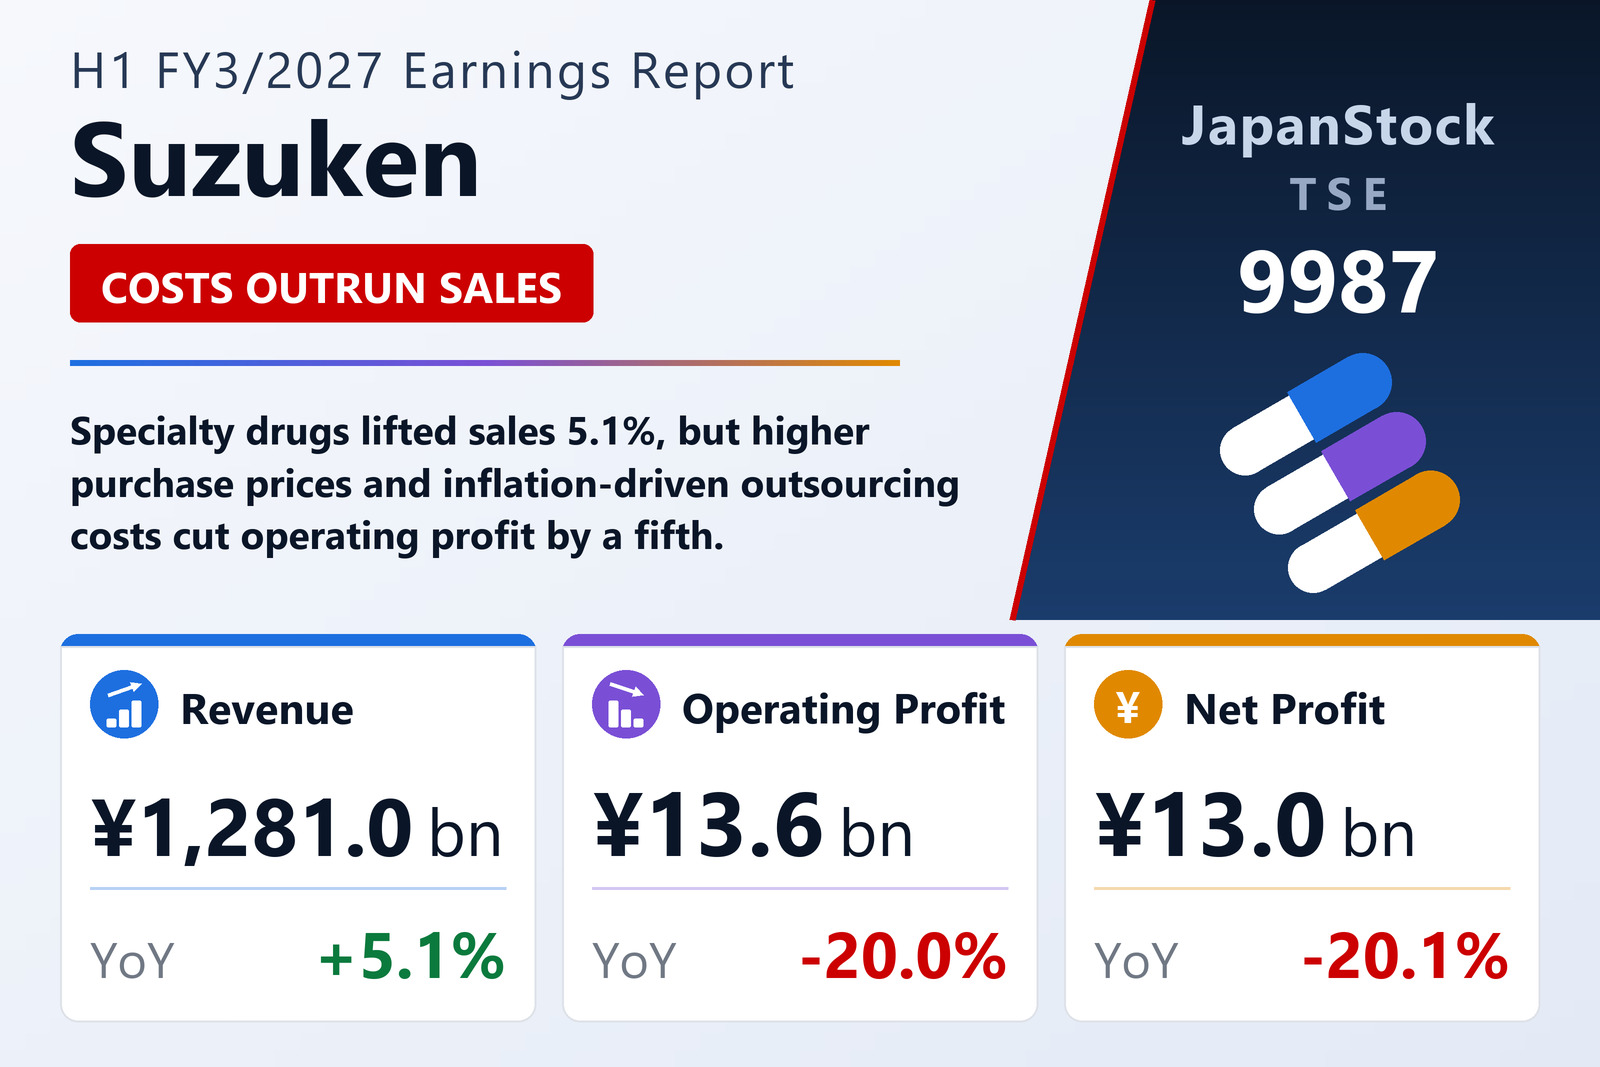
Suzuken Co., Ltd. (TSE: 9987), the Nagoya-based pharmaceutical wholesaler, published consolidated results for the first half of FY3/2027, April 1 to September 30, 2026, on November 12, 2026 under Japanese GAAP. Revenue rose 5.1% to ¥1,281,025 million, operating profit fell 20.0% to ¥13,561 million, ordinary profit fell 14.9% to ¥15,343 million and profit attributable to owners of the parent fell 20.1% to ¥12,974 million. The company said it kept working to secure appropriate margins and to review and contain selling, general and administrative expenses, but higher purchase prices for drugs and rising operating costs such as outsourcing fees, which it attributed to inflation, more than offset the sales gain.
From the first quarter Suzuken reorganised its reporting into six segments, and the prior-year figures have been restated on the new basis. Pharmaceutical Wholesale, which now also includes specialty-drug distribution, grew revenue 5.3% to ¥1,236,309 million while its operating profit fell 9.8% to ¥12,339 million on higher purchase and logistics costs. Digital Business lifted sales 39.6% to ¥1,690 million on promotion revenue from its AI-MS avatar service, but upfront spending on new services widened its operating loss to ¥855 million from ¥59 million. Logistics lifted operating profit 32.7% to ¥1,811 million after repricing contracts. Healthcare Product Development's operating profit fell 76.2% to ¥284 million because of higher manufacturing costs, research spending on the acromegaly drug paltusotine and the suspension of its Kumamoto plant after the earthquake of July 28, 2026, for which the company booked an extraordinary loss of ¥354 million and said the full impact is still being assessed. Community Healthcare & Nursing Care Support swung to an operating loss of ¥152 million.
Interim dividend raised, shares split two-for-one
Total assets rose to ¥1,217,937 million from ¥1,155,766 million at March 31, 2026, and the equity ratio slipped from 36.0% to 34.4%. Suzuken paid an interim dividend of ¥60, up from ¥50. It split its shares two-for-one with effect from October 1, 2026; the year-end dividend forecast of ¥30 is stated on the post-split basis and is equivalent to ¥60 before the split, or ¥120 for the full year against ¥100 for FY3/2026. Per-share profit of ¥96.07 is restated as if the split had applied from the start of the prior year. The board also enlarged the shareholder benefit for holders of 100 or more shares to ¥5,000 in value from ¥3,000 for the rest of the current medium-term plan.
Guidance unchanged
Suzuken left its FY3/2027 forecast unchanged at revenue of ¥2,563,000 million (+3.1%), operating profit of ¥31,200 million (−14.2%), ordinary profit of ¥34,300 million (−13.7%) and profit attributable to owners of ¥25,000 million (−34.4%). The first half delivered 50.0% of the revenue forecast and 43.5% of the operating-profit forecast.
| Metric | H1 FY3/2027 | H1 FY3/2026 | Change |
|---|---|---|---|
| Revenue (¥ million) | 1,281,025 | 1,219,440 | +5.1% |
| Operating profit (¥ million) | 13,561 | 16,958 | −20.0% |
| Ordinary profit (¥ million) | 15,343 | 18,032 | −14.9% |
| Net profit attrib. to owners of parent (¥ million) | 12,974 | 16,241 | −20.1% |
| EPS (¥) | 96.07 | 114.05 | −15.8% |
| Pharmaceutical Wholesale — revenue (¥ million) | 1,236,309 | 1,173,922 | +5.3% |
| Pharmaceutical Wholesale — segment profit (¥ million) | 12,339 | 13,682 | −9.8% |
| Digital Business — revenue (¥ million) | 1,690 | 1,210 | +39.6% |
| Digital Business — segment profit (¥ million) | −855 | −59 | loss widened |
| Logistics — revenue (¥ million) | 28,921 | 27,890 | +3.7% |
| Logistics — segment profit (¥ million) | 1,811 | 1,364 | +32.7% |
| Healthcare Product Development — revenue (¥ million) | 25,699 | 25,477 | +0.9% |
| Healthcare Product Development — segment profit (¥ million) | 284 | 1,192 | −76.2% |
| Community Healthcare & Nursing Care Support — revenue (¥ million) | 45,719 | 46,483 | −1.6% |
| Community Healthcare & Nursing Care Support — segment profit (¥ million) | −152 | 411 | profit to loss |
| Total assets (¥ million) | 1,217,937 | 1,155,766 | +5.4% |
| Net assets (¥ million) | 419,005 | 416,012 | +0.7% |
| Equity ratio | 34.4% | 36.0% | −1.6 pt |
| FY3/2027 guidance — revenue (¥ million) | 2,563,000 | — | +3.1% |
| FY3/2027 guidance — operating profit (¥ million) | 31,200 | — | −14.2% |
| FY3/2027 guidance — ordinary profit (¥ million) | 34,300 | — | −13.7% |
| FY3/2027 guidance — net profit (¥ million) | 25,000 | — | −34.4% |
| Interim dividend per share (¥) | 60.00 | 50.00 | +20.0% |
JapanStockPulse provides informational content only and does not constitute investment advice. Figures are taken from the company's published earnings short report and may be subject to subsequent revision.