Industrial products lead, consumer goods lag
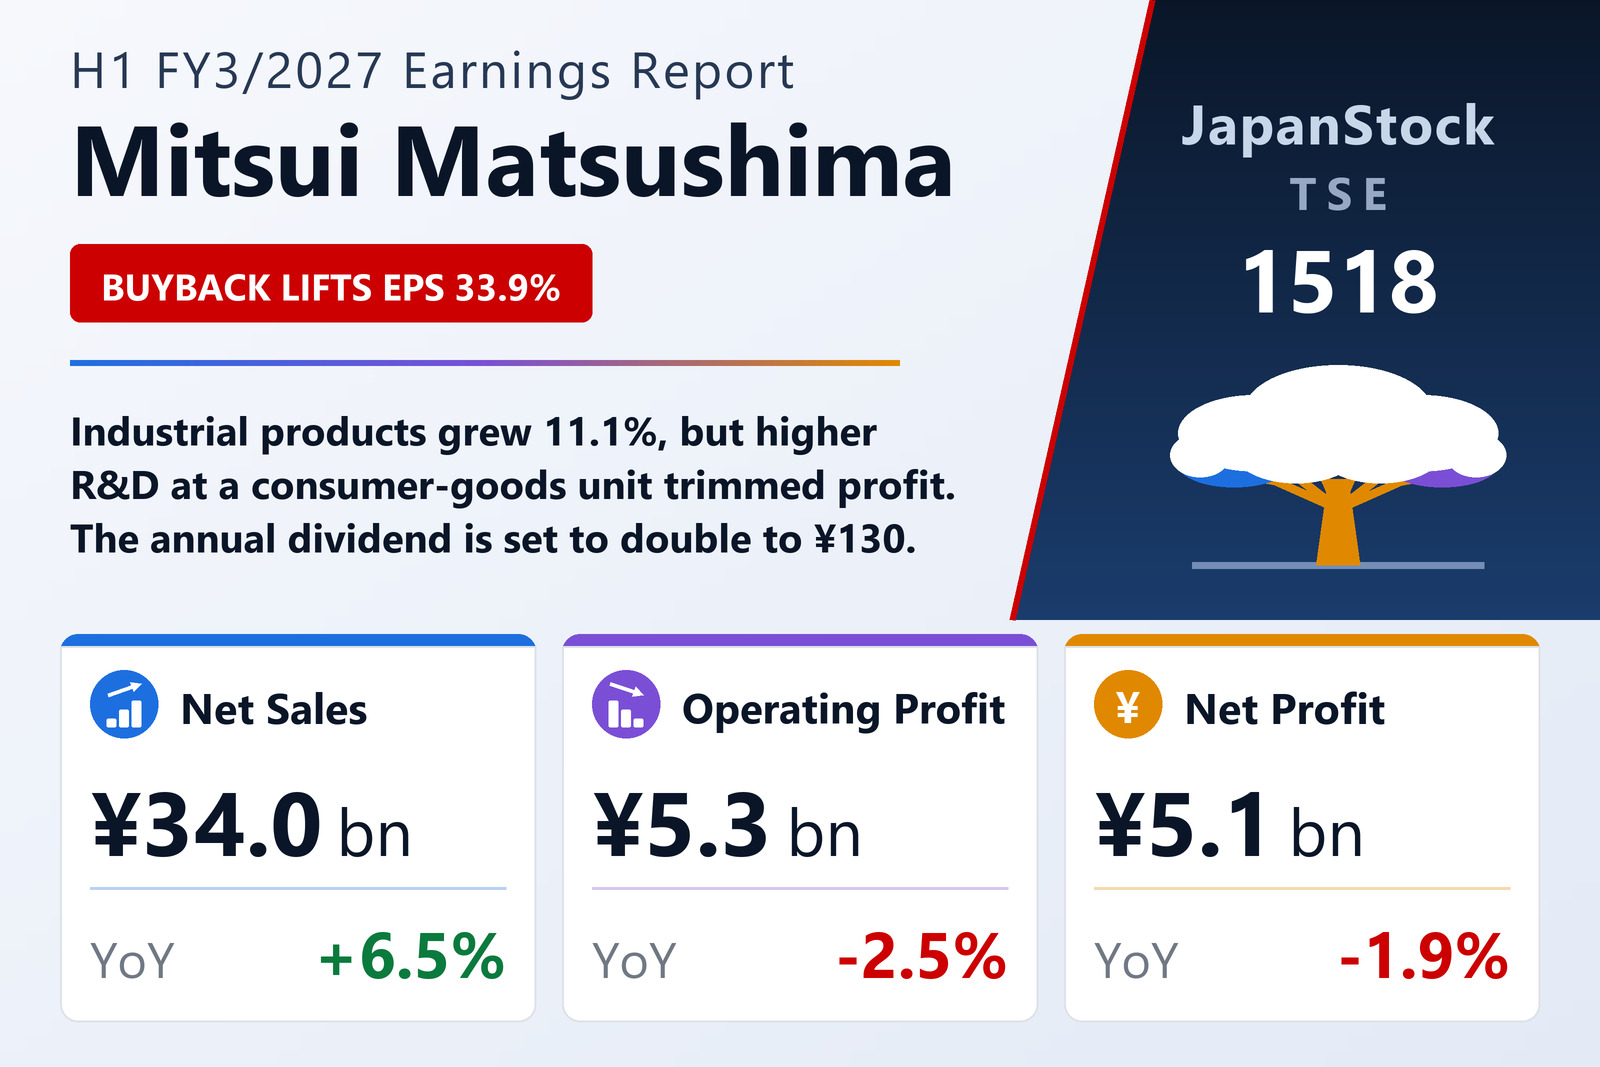
Mitsui Matsushima Holdings Co., Ltd. (TSE: 1518), a former coal miner that now owns a portfolio of specialist manufacturers and service companies, reported consolidated results for the first half of FY3/2027, April 1 to September 30, 2026, on November 13, 2026 under Japanese GAAP. Industrial Products grew sales 11.1% to ¥17,763 million and segment profit 4.6% to ¥2,959 million, led by higher sales at Sansei Denshi and Nippon Katan. Consumer Goods grew sales 2.9% to ¥13,741 million, but segment profit fell 18.5% to ¥1,232 million as research and development spending rose at Meiko Shokai. Finance & Other sales fell 2.9% to ¥2,510 million after the solar power business was sold last year, while segment profit edged up 1.1% to ¥1,072 million.
Net sales rose 6.5% to ¥33,983 million and operating profit fell 2.5% to ¥5,265 million. Dividend income of ¥497 million lifted ordinary profit 3.9% to ¥5,842 million. Extraordinary income included a ¥1,728 million gain on the sale of investment securities, but after ¥2,508 million of taxes, net profit attributable to owners fell 1.9% to ¥5,104 million. Share buybacks cut the average share count to about 37.42 million from 51.09 million a year earlier, so EPS rose 33.9% to ¥136.40. Five companies, Sanyo and its three subsidiaries plus Kounan, joined the consolidation scope in the half.
Balance sheet expands; dividend doubled
Total assets rose 14.0% to ¥145,860 million, reflecting the newly consolidated companies and higher investment securities, while borrowings rose to ¥61,194 million, and the equity ratio fell to 41.4% from 43.5%. The company kept the FY3/2027 forecast it published on July 22, 2026: net sales of ¥71,000 million (+8.4%), operating profit of ¥10,000 million (+4.5%), ordinary profit of ¥10,400 million (+4.6%) and net profit of ¥8,600 million (+28.0%). It paid an interim dividend of ¥65.00 and plans another ¥65.00 at the year end, for ¥130.00 against ¥64.00 last year on a post-split basis.
| Metric | H1 FY3/2027 | H1 FY3/2026 | Change |
|---|---|---|---|
| Net sales (¥ million) | 33,983 | 31,902 | +6.5% |
| Operating profit (¥ million) | 5,265 | 5,402 | −2.5% |
| Ordinary profit (¥ million) | 5,842 | 5,622 | +3.9% |
| Net profit attrib. to owners of parent (¥ million) | 5,104 | 5,204 | −1.9% |
| EPS (¥) | 136.40 | 101.86 | +33.9% |
| Consumer Goods — revenue (¥ million) | 13,741 | 13,360 | +2.9% |
| Consumer Goods — segment profit (¥ million) | 1,232 | 1,513 | −18.5% |
| Industrial Products — revenue (¥ million) | 17,763 | 15,992 | +11.1% |
| Industrial Products — segment profit (¥ million) | 2,959 | 2,828 | +4.6% |
| Finance & Other — revenue (¥ million) | 2,510 | 2,585 | −2.9% |
| Finance & Other — segment profit (¥ million) | 1,072 | 1,060 | +1.1% |
| Total assets (¥ million) | 145,860 | 127,921 | +14.0% |
| Net assets (¥ million) | 60,537 | 55,800 | +8.5% |
| Equity ratio | 41.4% | 43.5% | −2.1 pt |
| FY3/2027 guidance — revenue (¥ million) | 71,000 | — | +8.4% |
| FY3/2027 guidance — operating profit (¥ million) | 10,000 | — | +4.5% |
| FY3/2027 guidance — ordinary profit (¥ million) | 10,400 | — | +4.6% |
| FY3/2027 guidance — net profit (¥ million) | 8,600 | — | +28.0% |
| Annual dividend per share (¥) | 130.00 | 64.00 | +103.1% |
JapanStockPulse provides informational content only and does not constitute investment advice. Figures are taken from the company's published earnings short report and may be subject to subsequent revision.