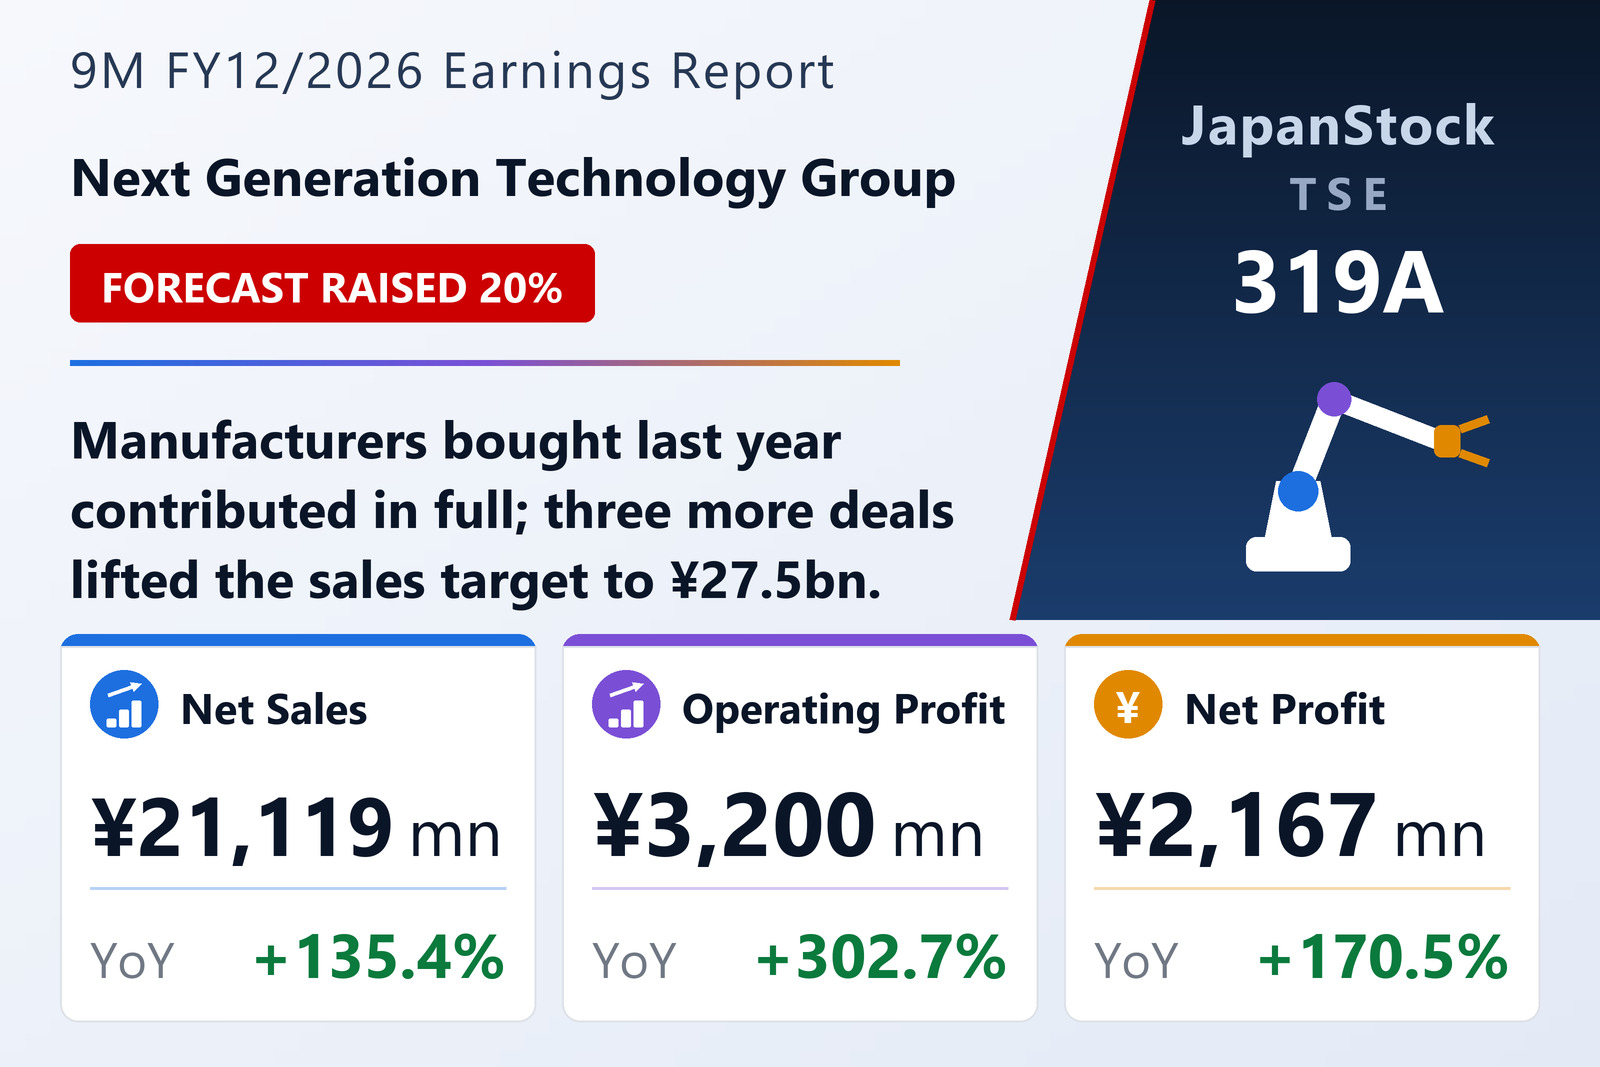
Last year's seven acquisitions contribute in full
Next Generation Technology Group Inc. (TSE: 319A) reported consolidated results for the first nine months of FY12/2026, January 1 to September 30, 2026, on November 13, 2026. With the mission of passing manufacturing technology to the next generation, it acquires small and mid-sized manufacturers and manufacturing-related businesses, both those without a successor and those struggling to grow alone, and supports them with production-management systems, web marketing and active recruitment. The seven groups it acquired last year, including Miyasaka Kogyo, Kanda Tekkosho and Taga Seisakusho, contributed for the full period, and existing businesses held up across a diversified portfolio. By the end of September it had bought three more, Horikoshi Seiki, Osaki Dengyosha and Sanko Giken Kogyo, which were consolidated from their acquisition dates.
Adjusted EBITDA, which adds back depreciation, goodwill amortisation, one-off acquisition costs and share-based compensation, rose 170.8% to ¥4,503 million, and adjusted net profit rose 151.3% to ¥2,219 million. Total assets grew 24.5% to ¥38,367 million, including a ¥1,986 million rise in goodwill and a ¥2,455 million increase in cash and deposits, and the equity ratio held at 29.6%.
Forecast raised on new acquisitions
Citing the three acquisitions, which were not in its original plan, and several group companies performing well, the company raised its FY12/2026 forecast from the February 13, 2026 figures: net sales to ¥27,500 million (+83.8%) from ¥23,000 million, adjusted EBITDA to ¥5,600 million (+93.3%) from ¥4,000 million, and adjusted net profit to ¥2,800 million (+85.0%) from ¥2,000 million. It plans no dividend.
| Metric | 9M FY12/2026 | 9M FY12/2025 | Change |
|---|---|---|---|
| Net sales (¥ million) | 21,119 | 8,970 | +135.4% |
| Operating profit (¥ million) | 3,200 | 795 | +302.7% |
| Adjusted EBITDA (¥ million) | 4,503 | 1,663 | +170.8% |
| Ordinary profit (¥ million) | 3,081 | 802 | +284.1% |
| Net profit attrib. to owners of parent (¥ million) | 2,167 | 801 | +170.5% |
| Adjusted net profit (¥ million) | 2,219 | 883 | +151.3% |
| Comprehensive income (¥ million) | 2,240 | 847 | +164.3% |
| EPS (¥) | 244.93 | 92.08 | +166.0% |
| Total assets (¥ million) | 38,367 | 30,826 | +24.5% |
| Net assets (¥ million) | 11,461 | 9,211 | +24.4% |
| Equity ratio | 29.6% | 29.6% | +0.0 pt |
| FY12/2026 guidance — revenue (¥ million) | 27,500 | — | +83.8% |
| FY12/2026 guidance — adjusted EBITDA (¥ million) | 5,600 | — | +93.3% |
| FY12/2026 guidance — adjusted net profit (¥ million) | 2,800 | — | +85.0% |
| Annual dividend per share (¥) | 0.00 | 0.00 | unchanged |
JapanStockPulse provides informational content only and does not constitute investment advice. Figures are taken from the company's published earnings short report and may be subject to subsequent revision.