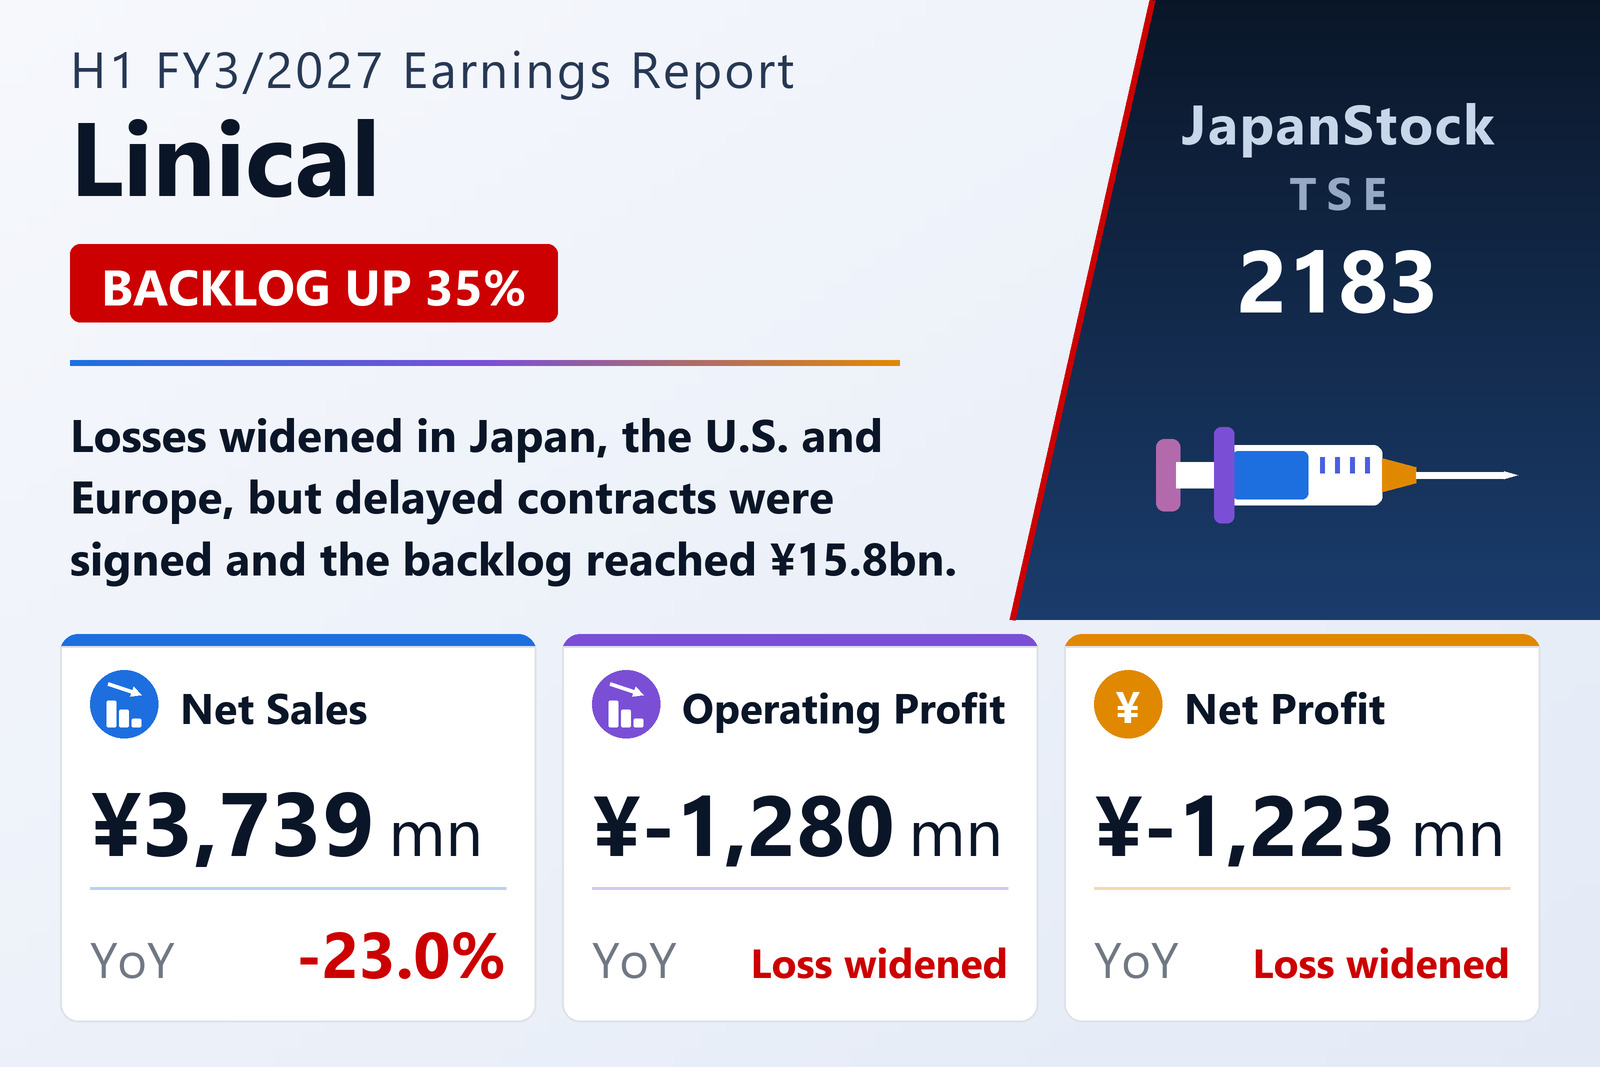
Losses widen in all three main regions
Linical Co., Ltd. (TSE: 2183), an Osaka-based contract research organisation that runs clinical trials for drug makers in Japan, Asia, the U.S. and Europe, reported consolidated results for H1 FY3/2027, April 1 to September 30, 2026, on November 16, 2026 under Japanese GAAP. Net sales fell 23.0% to ¥3,739 million and the operating loss widened to ¥1,280 million, with sales down and losses larger in Japan, the U.S. and Europe; Asia grew as Korea returned to an operating profit and Taiwan expanded, while China fell into the red. Foreign-exchange losses took the ordinary loss to ¥1,360 million, and the net loss attributable to owners was ¥1,223 million, or ¥54.18 per share.
The company says funding is moving away from COVID-19 vaccines into oncology, central nervous system and autoimmune disease, areas where it is strong. Large contracts in the U.S. and Europe that had been held up when the U.S. Food and Drug Administration scaled back work during last year's partial government shutdown have now been signed. The backlog was ¥14,199 million at September 30 and ¥15,780 million on November 16, up 35.2% from ¥11,673 million at the end of March; the U.S. rose 76.0% to ¥4,836 million and Europe 81.1% to ¥5,473 million, while Japan slipped 1.9% to ¥3,869 million.
Going-concern events, but cash in hand
Because it has posted operating losses for two consecutive years and again in this half, Linical reports events or conditions that may cast significant doubt on its ability to continue as a going concern, but it judges that no material uncertainty exists, citing revenue expected from the signed backlog and cash and deposits of ¥3,773 million. Net assets fell to ¥2,577 million and the equity ratio to 24.7% from 33.1%. It kept its full-year forecast of net sales of ¥10,680 million, up 23.2%, operating profit of ¥256 million and net profit of ¥180 million, and plans a year-end dividend of ¥8 per share.
| Metric | H1 FY3/2027 | H1 FY3/2026 | Change |
|---|---|---|---|
| Net sales (¥ million) | 3,739 | 4,859 | −23.0% |
| Operating profit (¥ million) | −1,280 | −511 | loss widened |
| Ordinary profit (¥ million) | −1,360 | −543 | loss widened |
| Net profit attrib. to owners of parent (¥ million) | −1,223 | −927 | loss widened |
| EPS (¥) | −54.18 | −41.07 | loss widened |
| Order backlog (¥ million) | 14,199 | 11,673 | +21.6% |
| Total assets (¥ million) | 10,427 | 11,999 | −13.1% |
| Net assets (¥ million) | 2,577 | 3,976 | −35.2% |
| Equity ratio | 24.7% | 33.1% | −8.4 pt |
| FY3/2027 guidance — revenue (¥ million) | 10,680 | — | +23.2% |
| FY3/2027 guidance — operating profit (¥ million) | 256 | — | loss to profit |
| FY3/2027 guidance — ordinary profit (¥ million) | 250 | — | loss to profit |
| FY3/2027 guidance — net profit (¥ million) | 180 | — | loss to profit |
| Annual dividend per share (¥) | 8.00 | 8.00 | unchanged |
JapanStockPulse provides informational content only and does not constitute investment advice. Figures are taken from the company's published earnings short report and may be subject to subsequent revision.