Currency props up gross profit
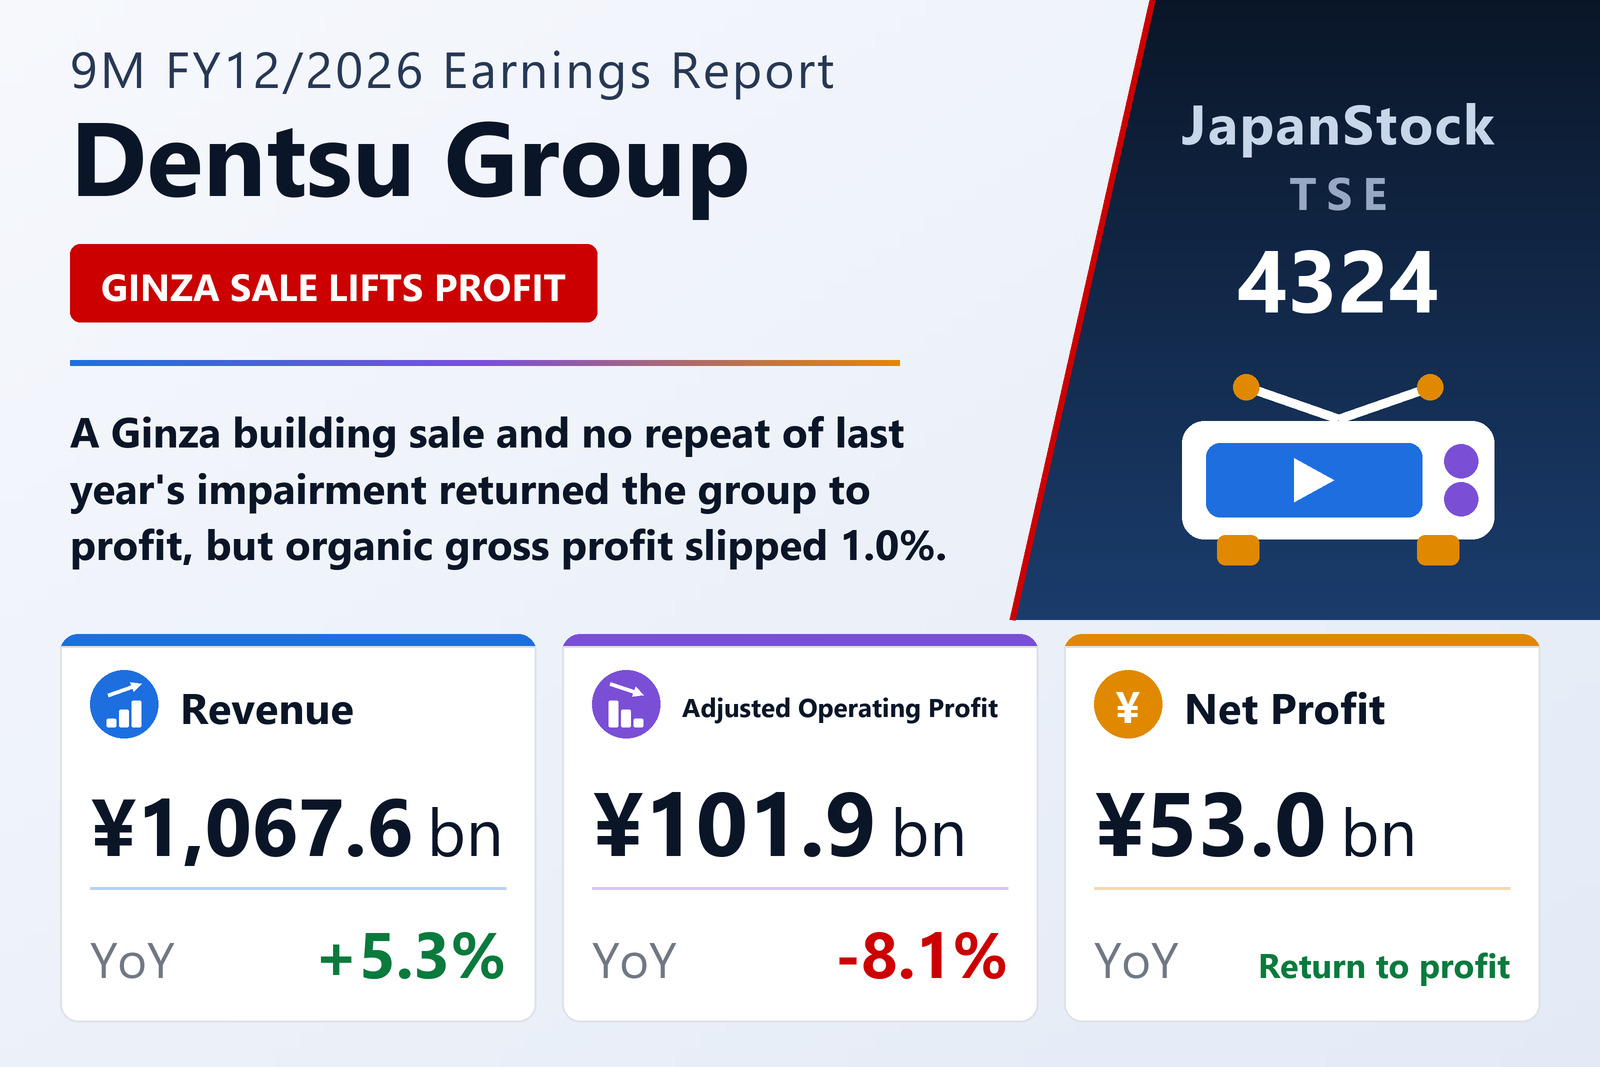
Dentsu Group Inc. (TSE: 4324), Japan's largest advertising group, reported results for the first nine months of FY12/2026, January 1 to September 30, 2026, on November 16, 2026 under IFRS. Gross profit fell 1.0% on an organic basis but rose 1.9% to ¥867.2 billion as the yen weakened against the dollar, pound and euro. Savings from rebuilding the business base came through, but lower sales excluding currency effects and higher internal investment cut adjusted operating profit by 8.1% to ¥101.9 billion, and the operating margin fell 120 basis points to 11.8%. Operating profit was ¥103.6 billion against a ¥7.4 billion loss a year earlier, which had carried an ¥86.6 billion impairment; this year includes a ¥29.6 billion gain on fixed-asset disposals, mainly the Dentsu Ginza Building sold in the first quarter, and ¥17.6 billion of restructuring costs.
In Japan, organic gross profit grew 2.5% on internet and TV advertising and digital transformation work, but reported gross profit fell 2.7% to ¥347.7 billion because CARTA HOLDINGS became an equity-method affiliate in January 2026, and adjusted operating profit fell 6.4% to ¥82.2 billion. The Americas shrank 5.5% organically, led by the U.S., and adjusted operating profit there fell 12.7% to ¥45.7 billion. EMEA's adjusted operating profit rose 23.1% to ¥18.3 billion despite a 2.6% organic decline, and APAC narrowed its adjusted operating loss to ¥1.9 billion from ¥5.7 billion.
Full-year guidance unchanged
Net profit attributable to owners was ¥53.0 billion, or ¥204.33 per share, and adjusted net profit fell 5.0% to ¥53.7 billion. Total assets fell to ¥2,913.6 billion and the ratio of equity attributable to owners rose to 14.7% from 11.7%. Dentsu kept the full-year forecast it issued on February 13, 2026: revenue of ¥1,491.5 billion, adjusted operating profit of ¥166.3 billion with an operating margin in the 13% range, operating profit of ¥152.6 billion and net profit attributable to owners of ¥69.7 billion. It plans no dividend for the year.
| Metric | 9M FY12/2026 | 9M FY12/2025 | Change |
|---|---|---|---|
| Revenue (¥ million) | 1,067,597 | 1,014,316 | +5.3% |
| Gross profit (¥ million) | 867,156 | 851,332 | +1.9% |
| Adjusted operating profit (¥ million) | 101,932 | 110,975 | −8.1% |
| Operating profit (¥ million) | 103,578 | −7,447 | loss to profit |
| Pre-tax profit (¥ million) | 93,364 | −19,035 | loss to profit |
| Net profit attrib. to owners of parent (¥ million) | 53,040 | −61,531 | loss to profit |
| Adjusted net profit (¥ million) | 53,705 | 56,557 | −5.0% |
| EPS (¥) | 204.33 | −237.04 | loss to profit |
| Japan — segment gross profit (¥ million) | 347,676 | — | −2.7% |
| Japan — adjusted operating profit (¥ million) | 82,192 | — | −6.4% |
| Americas — segment gross profit (¥ million) | 233,687 | — | +1.4% |
| Americas — adjusted operating profit (¥ million) | 45,710 | — | −12.7% |
| EMEA — segment gross profit (¥ million) | 204,627 | — | +8.7% |
| EMEA — adjusted operating profit (¥ million) | 18,339 | — | +23.1% |
| APAC — segment gross profit (¥ million) | 76,280 | — | +8.5% |
| APAC — adjusted operating profit (¥ million) | −1,924 | −5,694 | loss narrowed |
| Total assets (¥ million) | 2,913,638 | 3,206,787 | −9.1% |
| Equity attrib. to owners of parent (¥ million) | 427,254 | 374,849 | +14.0% |
| Equity ratio | 14.7% | 11.7% | +3.0 pt |
| FY12/2026 guidance — revenue (¥ million) | 1,491,500 | — | +3.9% |
| FY12/2026 guidance — adjusted operating profit (¥ million) | 166,300 | — | −3.6% |
| FY12/2026 guidance — operating profit (¥ million) | 152,600 | — | n.m. |
| FY12/2026 guidance — net profit (¥ million) | 69,700 | — | n.m. |
| Annual dividend per share (¥) | 0.00 | 0.00 | unchanged |
JapanStockPulse provides informational content only and does not constitute investment advice. Figures are taken from the company's published earnings short report and may be subject to subsequent revision.