Security and back-office demand
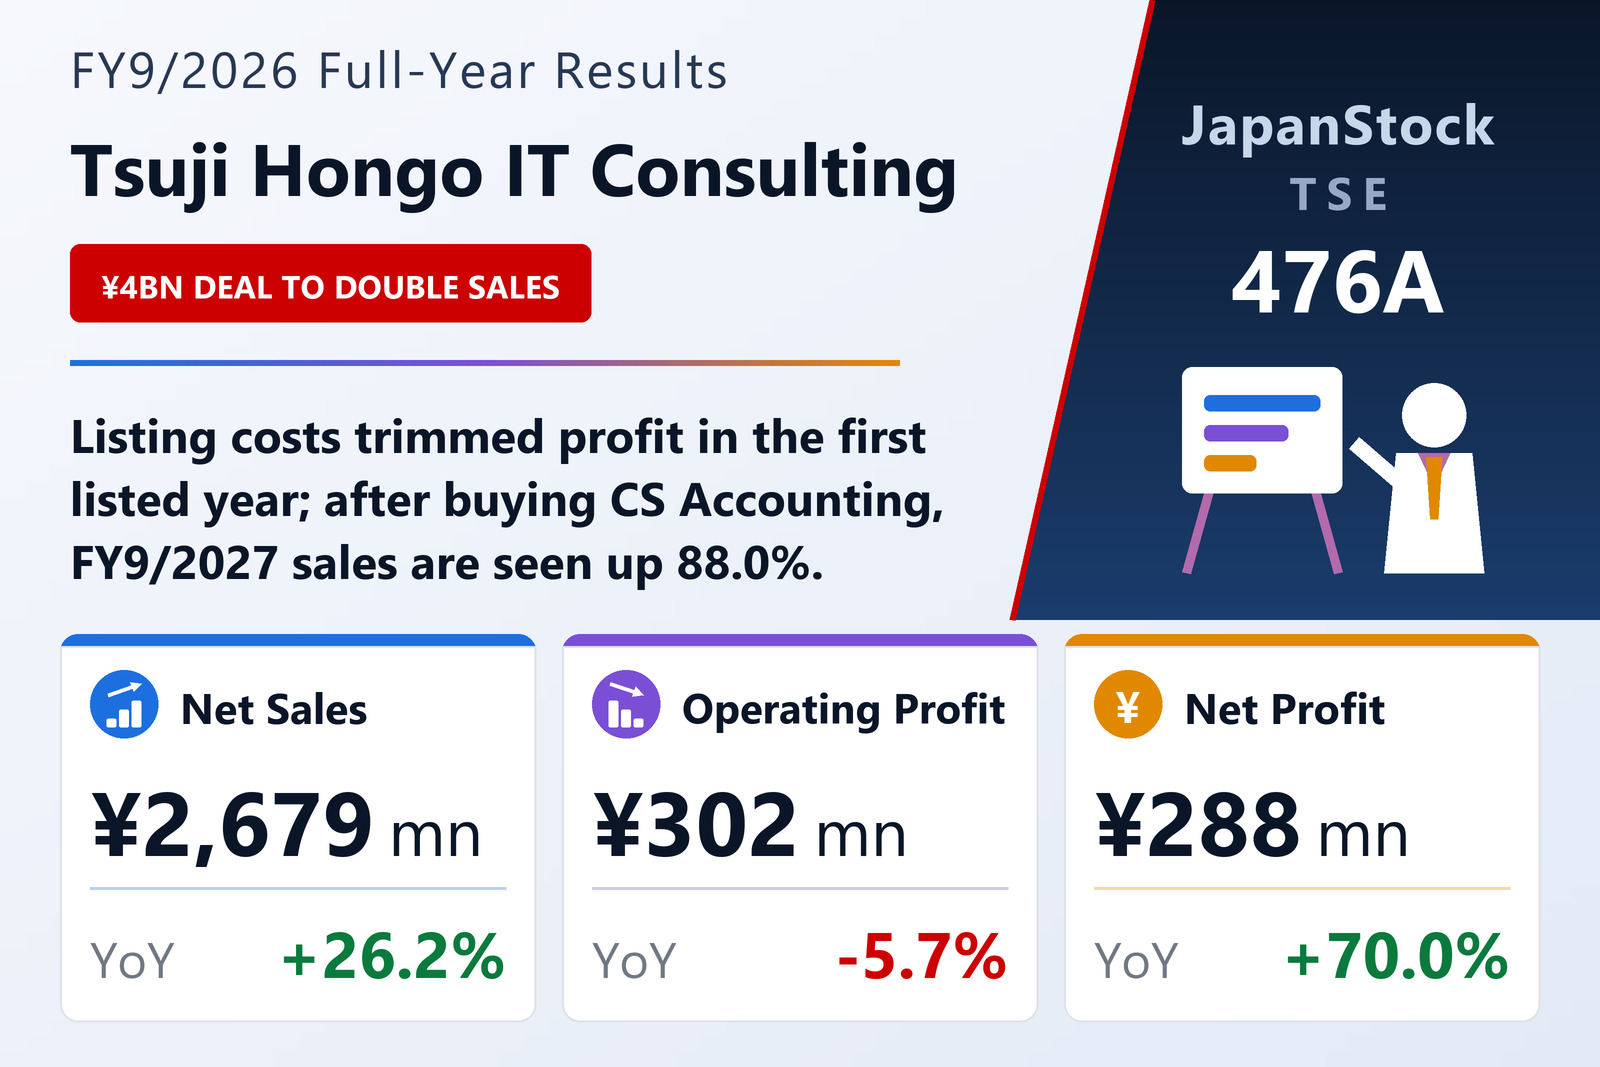
Tsuji Hongo IT Consulting Co., Ltd. (TSE: 476A), which provides digital-transformation consulting, information-security consulting, system implementation and back-office outsourcing, reported consolidated results for FY9/2026, October 1, 2025 to September 30, 2026, on November 16, 2026 under Japanese GAAP. It listed on the TSE Standard market on December 19, 2025. Orders were strong across its consulting work, driven by interest in generative AI and digital transformation; demand for security consulting grew as ransomware damage reached a record; and companies short of staff outsourced more accounting, payroll and social-insurance work. Net sales rose 26.2% to ¥2,679 million, but listing-related costs and the opening of an office in Ichigaya, Tokyo, in April 2026 cut operating profit 5.7% to ¥302 million and ordinary profit 7.5% to ¥300 million.
Extraordinary gains of ¥121 million, mainly an ¥84 million gain on a business transfer and a ¥34 million reversal of a provision for losses related to unauthorised access, lifted pre-tax profit to ¥421 million, and net profit attributable to owners rose 70.0% to ¥288 million, or ¥147.35 per share. Proceeds of ¥589 million from issuing shares raised year-end cash to ¥1,518 million, and the equity ratio rose to 74.8% from 60.4%. It pays no dividend.
A ¥4.0 billion acquisition
On October 23, 2026 the company bought all of CS Accounting Co., Ltd., which has about 150 specialists including certified public accountants and provides accounting and HR outsourcing mainly to listed companies and their groups, for ¥3,999 million in cash; it financed the deal partly with ¥2,000 million borrowed from two domestic banks. Its FY9/2027 forecast calls for net sales of ¥5,039 million, up 88.0%, operating profit of ¥769 million, up 154.5%, ordinary profit of ¥723 million and net profit of ¥453 million.
| Metric | FY9/2026 | FY9/2025 | Change |
|---|---|---|---|
| Net sales (¥ million) | 2,679 | 2,124 | +26.2% |
| Operating profit (¥ million) | 302 | 320 | −5.7% |
| Ordinary profit (¥ million) | 300 | 324 | −7.5% |
| Net profit attrib. to owners of parent (¥ million) | 288 | 169 | +70.0% |
| EPS (¥) | 147.35 | 100.17 | +47.1% |
| Total assets (¥ million) | 2,524 | 1,672 | +51.0% |
| Net assets (¥ million) | 1,889 | 1,009 | +87.2% |
| Equity ratio | 74.8% | 60.4% | +14.4 pt |
| FY9/2027 guidance — revenue (¥ million) | 5,039 | — | +88.0% |
| FY9/2027 guidance — operating profit (¥ million) | 769 | — | +154.5% |
| FY9/2027 guidance — ordinary profit (¥ million) | 723 | — | +140.9% |
| FY9/2027 guidance — net profit (¥ million) | 453 | — | +57.3% |
| Annual dividend per share (¥) | 0.00 | 0.00 | unchanged |
JapanStockPulse provides informational content only and does not constitute investment advice. Figures are taken from the company's published earnings short report and may be subject to subsequent revision.