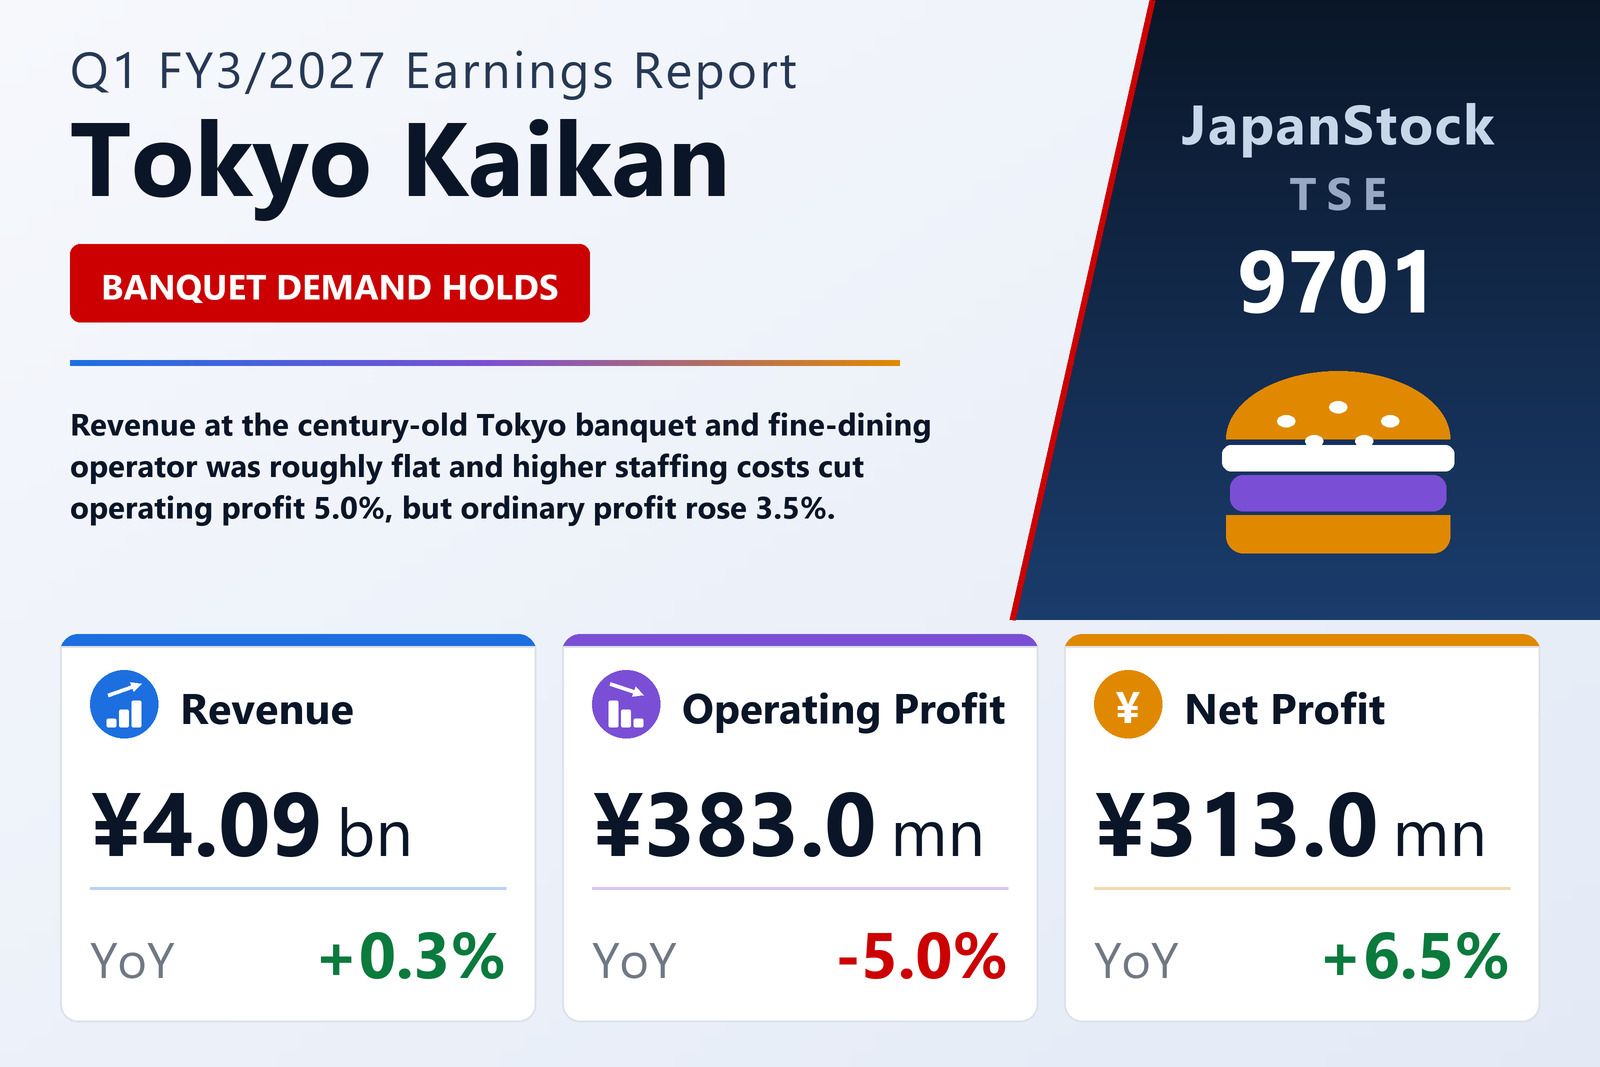
Tokyo Kaikan Co., Ltd. (TSE: 9701), the century-old operator of the historic Tokyo Kaikan banquet, wedding and fine-dining complex in Marunouchi near the Imperial Palace, reported first-quarter results for the three months to June 30, 2026 under Japanese GAAP on a non-consolidated basis. Revenue was roughly flat, edging up 0.3% to ¥4,087 million, while operating profit slipped 5.0% to ¥383 million on higher staffing costs. Ordinary profit rose 3.5% to ¥457 million and net profit rose 6.5% to ¥313 million.
Banquets and dining hold up
Revenue was essentially unchanged from a year earlier at ¥4,087 million, up ¥14 million, as demand for the company's banquets, weddings, restaurant dining and confectionery held firm. Ordinary profit climbed 3.5% to ¥457 million and net profit rose 6.5% to ¥313 million, both lifted by non-operating income even as operating profit eased. Tokyo Kaikan's business is seasonally front-loaded, with the first half of the year typically carrying a larger share of annual revenue than the second.
Investing in people
Operating profit dipped 5.0% to ¥383 million, down ¥20 million, as higher personnel costs from added headcount weighed on the company's single restaurant-and-banquet segment. The decline reflects front-loaded hiring and human-capital spending under a new medium-term management plan covering fiscal years 2026 through 2028, which prioritises organisational and human-capital investment ahead of expected returns.
Steady balance sheet, guidance maintained
Total assets rose to ¥30,589 million as of June 30, 2026, up ¥415 million from March 31, 2026, while net assets climbed ¥373 million to ¥13,504 million. The equity ratio improved 0.6 point to 44.1%. The company left its first-half and full-year forecasts unchanged from the guidance announced on May 7, 2026, with demand seasonally weighted toward the first half of the fiscal year.
| Metric | Q1 FY3/2027 | Q1 FY3/2026 | YoY |
|---|---|---|---|
| Revenue (¥ billion) | 4.09 | 4.07 | +0.3% |
| Operating profit (¥ million) | 383 | 403 | -5.0% |
| Ordinary profit (¥ million) | 457 | 442 | +3.5% |
| Net profit (¥ million) | 313 | 294 | +6.5% |
| Total assets (¥ billion) | 30.59 | 30.17 | +1.4% |
| Net assets (¥ billion) | 13.50 | 13.13 | +2.8% |
| Equity ratio (%) | 44.1 | 43.5 | +0.6pt |
JapanStockPulse provides informational content only and does not constitute investment advice. Figures are taken from the company's published earnings short report and may be subject to subsequent revision.