Revenue up 15.3%, cost of sales up 20.1% — the margin went the other way
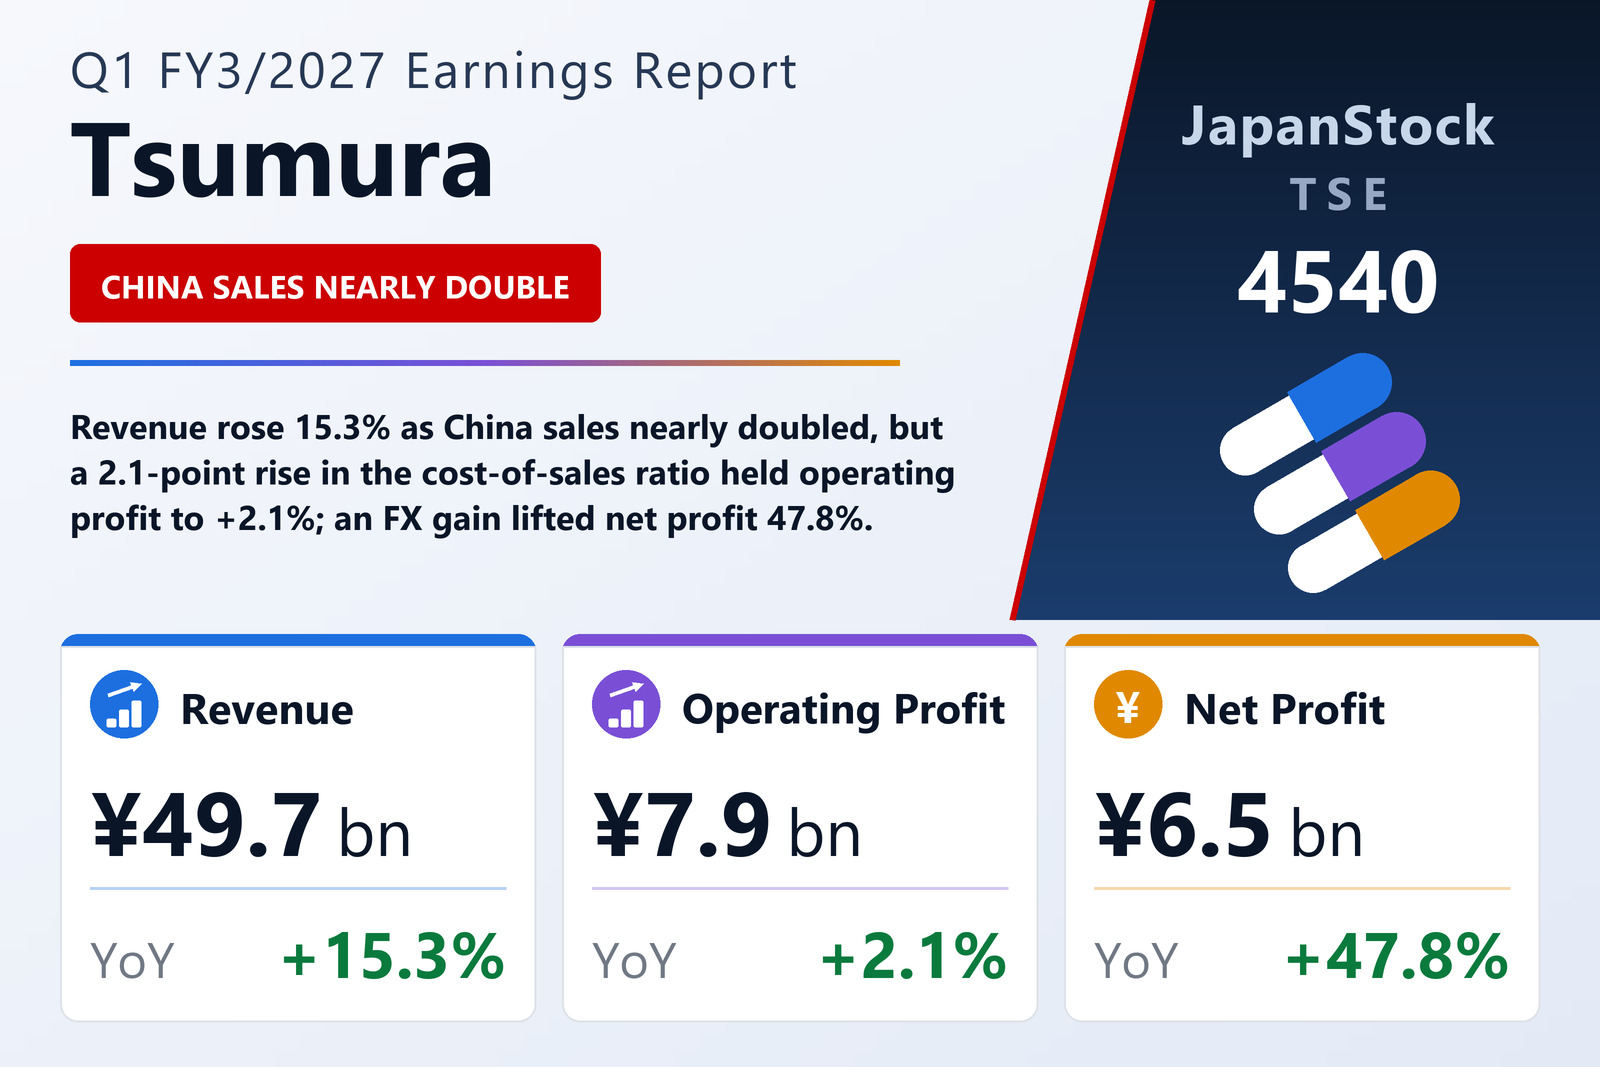
TSUMURA & CO. (TSE: 4540), the maker of prescription Kampo (traditional Japanese herbal) medicines, published consolidated results for the first quarter of FY3/2027, the three months from April 1 to June 30, 2026, on August 6, 2026 under Japanese GAAP. Revenue rose 15.3% to ¥49,704 million, operating profit 2.1% to ¥7,881 million, ordinary profit 57.8% to ¥9,753 million and profit attributable to owners of the parent 47.8% to ¥6,457 million, for earnings of ¥86.63 per share against ¥58.16. The company is listed on the Prime market of the Tokyo Stock Exchange.
The quarter's arithmetic is short. Revenue added ¥6,609 million but operating profit only ¥161 million, because cost of sales rose faster than revenue — 20.1% to ¥27,107 million — lifting the cost-of-sales ratio by 2.1 points to 54.5%. The filing attributes that rise to exchange-rate effects and the growing share of China business revenue. Gross profit therefore grew only 10.1% to ¥22,597 million, and the gross margin narrowed from 47.6% to 45.5%. Selling, general and administrative expenses rose 15.0% to ¥14,715 million, which the filing puts down to the consolidation of Shanghai Hongqiao, a Chinese maker of decoction pieces, and to currency; that was slightly slower than revenue, so the SG&A ratio eased 0.1 point to 29.6%. Almost the whole margin loss thus came from cost of sales: the operating margin fell 2.0 points, from 17.9% to 15.9%.
China nearly doubled its sales and turned a profit; the domestic business earned less
The company reports a single pharmaceutical segment, but its qualitative section splits the quarter into a domestic and a China business. Domestic revenue rose 6.7% to ¥41,475 million; China business revenue rose 94.8% to ¥8,228 million from ¥4,223 million, taking its share of group revenue from 9.8% to 16.6%. The filing attributes the China increase to the consolidation of Shanghai Hongqiao and to higher sales of raw crude drugs and decoction pieces (cut crude drugs) at Ping An Tsumura, Shenzhen Tsumura and other subsidiaries. There was no significant change in the scope of consolidation during the quarter itself, so the Shanghai Hongqiao effect reflects the comparison with the year-earlier quarter rather than an addition made in this period.
Profit moved the other way. Domestic operating profit fell 6.0% to ¥7,498 million from ¥7,981 million even as domestic revenue grew, so the domestic operating margin slipped from roughly 20.5% to 18.1%. The China business swung from an operating loss of ¥261 million to a profit of ¥382 million, a margin of about 4.6%. China's ¥644 million improvement more than offset the domestic business's ¥482 million decline, which is how group operating profit still rose ¥161 million. The filing explains the cost ratio and SG&A at group level only; it offers no separate explanation for the fall in domestic profit.
Prescription Kampo grew 6.8% in value and 3.4% in volume
The core of the domestic business, the 129 prescription Kampo formulations, grew 6.8% to ¥39,759 million. The filing credits continued growth in formulations related to edema, headache and dizziness, together with information activities tailored to the needs of healthcare professionals. Actual sales volume — deliveries from distributors and wholesalers to medical institutions, which the company treats as the measure of real demand — rose 3.4%, about half the rate of revenue; the filing does not break down the difference. Healthcare products, chiefly over-the-counter Kampo preparations, rose 6.9% to ¥1,471 million on an increase in the number of stores carrying them.
The company tracks two strategic groups. Its five Ikuyaku formulations — chosen for diseases where new drugs struggle and Kampo shows a specific effect, and backed by clinical evidence the company is building — rose 6.2% to ¥10,492 million, with volume up 2.4%; the largest, Daikenchuto, grew 5.6% to ¥3,836 million. The five Growing formulations, the next tier, targeted at inclusion in clinical guidelines, rose 12.0% to ¥6,734 million on volume growth of 8.0%. Goreisan led them, up 14.9% to ¥2,323 million with volume up 14.8% — the one named formulation whose volume kept pace with its value — while Hochuekkito grew 6.4% in value on a 1.0% fall in volume. The other 119 formulations rose 5.6% to ¥22,532 million, on volume up 2.7%.
Below the operating line, an exchange-rate swing did the work
Ordinary profit rose ¥3,571 million, more than twenty times the operating increase, and the filing attributes it to an exchange gain on loans to overseas subsidiaries. That gain was ¥2,143 million, against an exchange loss of ¥1,698 million a year earlier — a swing of ¥3,841 million, larger than the whole rise in ordinary profit. Interest expense rose to ¥547 million from ¥147 million. Pre-tax profit was ¥9,762 million, up 58.7%, and income taxes ¥3,039 million, up 77.7%, taking the effective rate from 27.8% to 31.1%. Net profit was ¥6,723 million, of which ¥265 million went to non-controlling interests against ¥73 million a year earlier, leaving ¥6,457 million for owners of the parent. Comprehensive income was ¥13,159 million against a negative ¥4,184 million, chiefly because the foreign-currency translation adjustment swung to +¥5,928 million from −¥8,165 million.
Capital spending and working capital drew cash; short-term borrowing filled the gap
Total assets rose 1.6% to ¥602,148 million from ¥592,766 million at March 31, 2026. Current assets grew ¥5,692 million, mainly on inventories: work in process rose to ¥29,957 million from ¥25,115 million and merchandise and finished goods to ¥25,763 million from ¥24,262 million, while raw materials and supplies were little changed at ¥114,379 million, about 19% of total assets. Non-current assets grew ¥3,690 million, mainly property, plant and equipment. Liabilities rose ¥2,139 million to ¥223,302 million, chiefly on short-term borrowings, which climbed to ¥15,794 million from ¥3,329 million; ¥15,000 million of bonds falling due within a year was also reclassified to current liabilities. Net assets rose ¥7,243 million to ¥378,846 million, largely through a ¥4,622 million increase in accumulated other comprehensive income, mainly translation adjustments, and ¥2,108 million in non-controlling interests; shareholders' equity rose only ¥511 million. The equity ratio was unchanged at 54.3%.
Cash and equivalents fell ¥7,056 million to ¥71,205 million. Operating activities used ¥4,444 million, against ¥1,168 million a year earlier: pre-tax profit of ¥9,762 million and depreciation of ¥3,427 million were outweighed by income taxes paid of ¥4,842 million, a ¥4,141 million fall in trade payables and increases of ¥3,267 million in receivables and ¥2,869 million in inventories. Investing activities used ¥10,771 million, of which purchases of property, plant and equipment were ¥9,933 million against ¥2,373 million, more than four times the year-earlier figure. Free cash flow was therefore about −¥15,215 million. Financing brought in ¥6,611 million, as ¥12,465 million of short-term borrowing covered dividends paid of ¥5,824 million.
Guidance unchanged, with the first quarter behind on operating profit and ahead below it
Tsumura left its guidance, published on May 13, 2026, unchanged. For FY3/2027 it expects revenue of ¥213,600 million (+10.9%), operating profit of ¥37,500 million (+6.5%), ordinary profit of ¥35,500 million (−11.3%) and profit attributable to owners of ¥26,200 million (−6.8%), or ¥351.46 per share. The first quarter delivered 23.3% of guided revenue, 21.0% of operating profit, 27.5% of ordinary profit and 24.6% of net profit. For the first half the company guides to revenue of ¥102,500 million (+14.0%), operating profit of ¥17,200 million (+0.5%), ordinary profit of ¥16,400 million (−0.1%) and net profit of ¥11,100 million (−11.0%). Taken literally, that implies a second quarter with revenue of about ¥52,796 million and operating profit of about ¥9,319 million, but ordinary profit of only about ¥6,647 million; the half-year figures were set before this quarter's exchange gain was booked, and the filing does not comment on them.
The dividend forecast was also left unchanged at ¥158.00 per share for the year — ¥79.00 at the interim and ¥79.00 at the year-end — against ¥147.00 for FY3/2026 (¥68.00 and ¥79.00), an increase of 7.5% and about 45% of guided earnings per share. Issued shares were unchanged at 76,758,362, and treasury shares stood at 2,212,210, including shares held by the executive-compensation BIP trust and the stock-granting ESOP trust.
| Metric | Q1 FY3/2027 | Q1 FY3/2026 | Change |
|---|---|---|---|
| Revenue (¥ million) | 49,704 | 43,094 | +15.3% |
| Domestic business — revenue (¥ million) | 41,475 | 38,871 | +6.7% |
| China business — revenue (¥ million) | 8,228 | 4,223 | +94.8% |
| Prescription Kampo, 129 formulations — revenue (¥ million) | 39,759 | 37,223 | +6.8% |
| Gross profit (¥ million) | 22,597 | 20,518 | +10.1% |
| Gross margin | 45.5% | 47.6% | −2.1 pt |
| SG&A expenses (¥ million) | 14,715 | 12,798 | +15.0% |
| Operating profit (¥ million) | 7,881 | 7,719 | +2.1% |
| Operating margin | 15.9% | 17.9% | −2.0 pt |
| Domestic business — operating profit (¥ million) | 7,498 | 7,981 | −6.0% |
| China business — operating profit/loss (¥ million) | 382 | −261 | loss to profit |
| Foreign-exchange gain/loss (¥ million) | 2,143 | −1,698 | n.m. |
| Ordinary profit (¥ million) | 9,753 | 6,181 | +57.8% |
| Net profit attrib. to owners of parent (¥ million) | 6,457 | 4,367 | +47.8% |
| EPS (¥) | 86.63 | 58.16 | +49.0% |
| Comprehensive income (¥ million) | 13,159 | −4,184 | n.m. |
| Total assets (¥ million) | 602,148 | 592,766 | +1.6% |
| Net assets (¥ million) | 378,846 | 371,603 | +1.9% |
| Equity ratio | 54.3% | 54.3% | unchanged |
| Operating cash flow (¥ million) | −4,444 | −1,168 | n.m. |
| Investing cash flow (¥ million) | −10,771 | −3,057 | n.m. |
| FY3/2027 guidance — revenue (¥ million) | 213,600 | — | +10.9% |
| FY3/2027 guidance — operating profit (¥ million) | 37,500 | — | +6.5% |
| FY3/2027 guidance — ordinary profit (¥ million) | 35,500 | — | −11.3% |
| FY3/2027 guidance — net profit (¥ million) | 26,200 | — | −6.8% |
| FY3/2027 guidance — EPS (¥) | 351.46 | — | — |
| Annual dividend per share (¥) | 158.00 | 147.00 | +7.5% |
JapanStockPulse provides informational content only and does not constitute investment advice. Figures are taken from the company's published earnings short report and may be subject to subsequent revision.