A 15% revenue gain, 60% of it currency
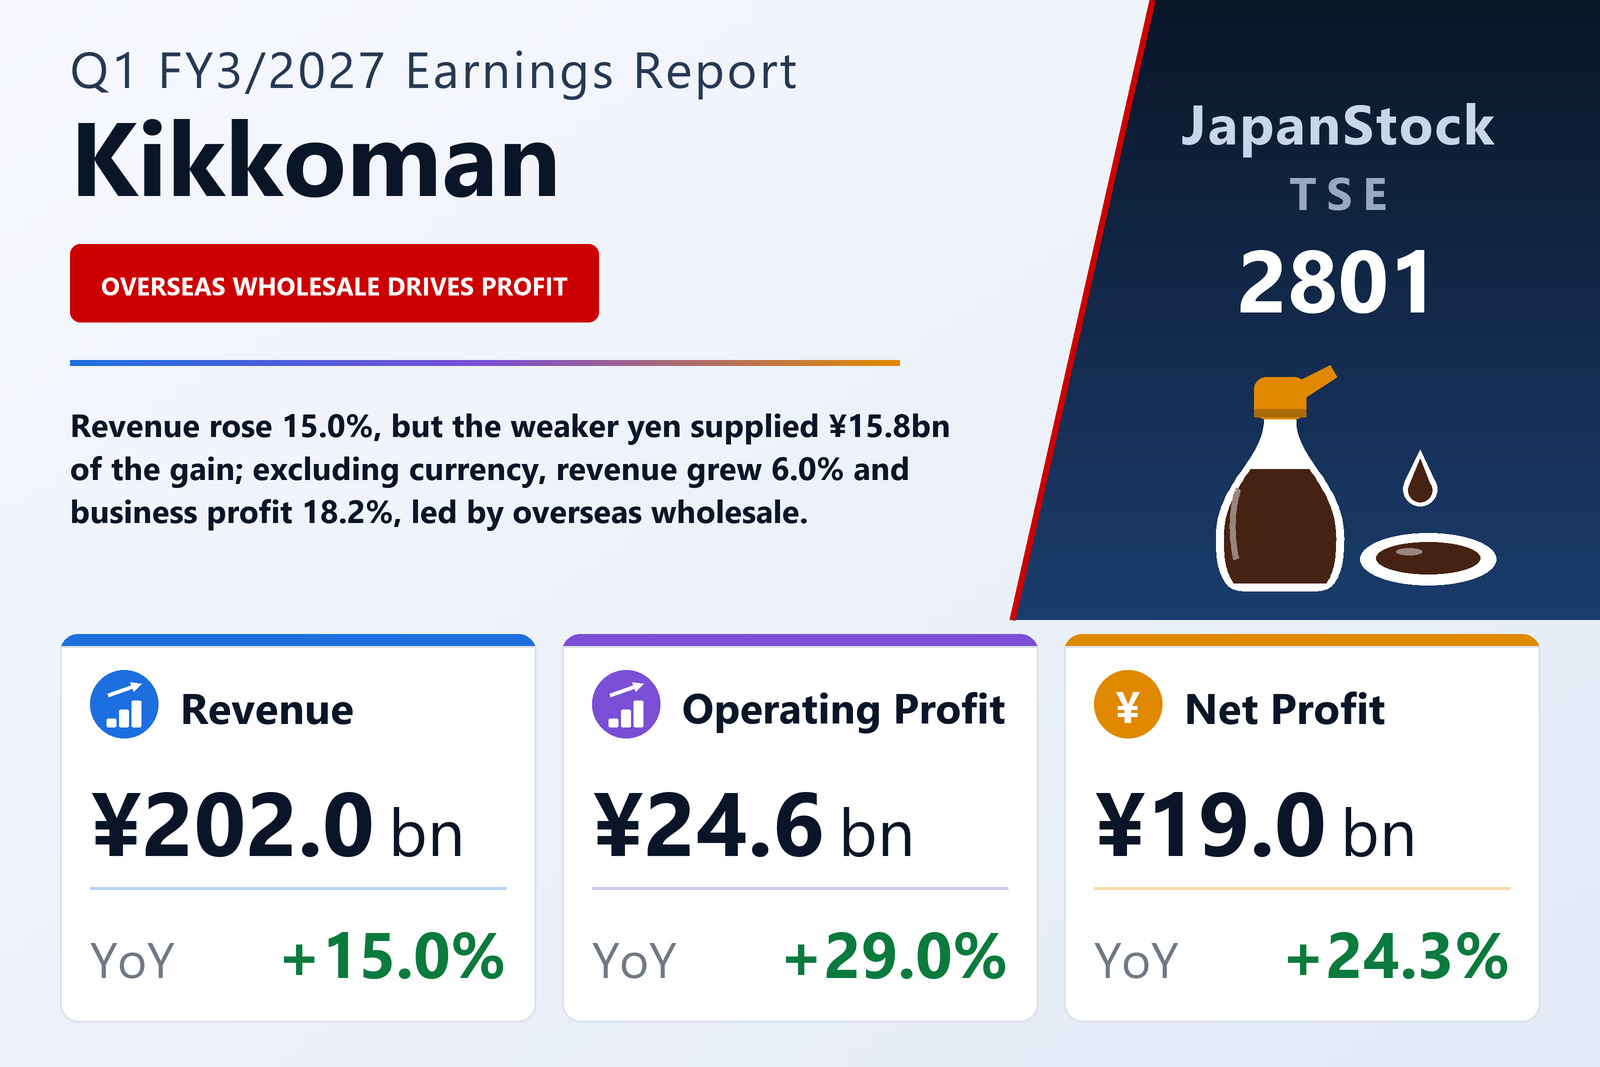
Kikkoman Corporation (TSE: 2801), the soy sauce maker that also runs an oriental-food wholesale business, published consolidated results for the first quarter of FY3/2027, the three months from April 1 to June 30, 2026, on August 5, 2026 under IFRS. Revenue rose 15.0% to ¥202,032 million, business profit — revenue less cost of sales and SG&A, the measure Kikkoman leads with — 29.3% to ¥25,256 million, operating profit 29.0% to ¥24,627 million, pre-tax profit 24.1% to ¥26,166 million and profit attributable to owners of the parent 24.3% to ¥19,017 million, for basic earnings of ¥20.53 per share against ¥16.24. The filing names the Tokyo Stock Exchange as the listing venue and states that the quarterly statements were not reviewed by an auditor.
The currency move behind those rates was large. The yen averaged ¥160.51 to the dollar against ¥145.19 a year earlier and ¥185.45 to the euro against ¥164.37, and Kikkoman quantifies what that did on translation: ¥15,841 million of the ¥26,372 million revenue increase and ¥2,175 million of the ¥5,723 million business-profit increase. Stripped of it, revenue grew ¥10,530 million, or 6.0%, and business profit ¥3,548 million, or 18.2%; on the same basis operating profit grew 18.3% and attributable profit 14.0%. Currency therefore supplied about 60% of the revenue gain but only about 38% of the profit gain — underlying business profit grew roughly three times as fast as underlying revenue.
The margin widened at the gross line and held through SG&A
Cost of sales rose 12.9% to ¥130,348 million, slower than revenue, so gross profit grew 19.1% to ¥71,684 million and the gross margin widened from 34.3% to 35.5%. Selling, general and administrative expenses rose 14.2% to ¥46,428 million — a little faster than revenue but well behind gross profit — which lifted the business-profit margin from 11.1% to 12.5%. The filing explains the quarter segment by segment but does not attribute the gross-margin gain to specific cost lines.
Below business profit the picture softens slightly. Other income was ¥669 million against ¥681 million and other expenses ¥1,299 million against ¥1,123 million, including foreign-exchange losses of ¥296 million, so operating profit grew marginally less than business profit, to a 12.2% margin from 10.9%. Net finance income fell to ¥1,401 million from ¥1,873 million, as net interest and dividends slipped to ¥1,044 million from ¥1,203 million and exchange and derivative valuation gains to ¥417 million from ¥639 million; that is why pre-tax profit rose 24.1% rather than 29%. Income taxes were ¥6,946 million, up 23.5%, an effective rate of about 26.5% against 26.7%. Earnings per share grew faster than profit, 26.4% against 24.3%, because the average share count fell 1.6% to 926,539,858 from 941,917,460.
Overseas wholesale was the engine
Kikkoman reports four segments, each measured on business profit. Overseas Food Wholesale, which buys and sells oriental foods in Japan and abroad, was the largest by revenue and the fastest-improving: revenue of ¥117,119 million, up 18.1%, and business profit of ¥9,395 million, up 46.8% — still up 6.1% and 33.8% once currency is removed. Overseas Food Manufacturing & Sales — soy sauce, Del Monte products and other foods made and sold abroad, plus exports — posted revenue of ¥48,231 million, up 14.8%, and business profit of ¥12,810 million, up 16.1%, but only 3.9% and 5.2% excluding currency. Together the two overseas segments produced ¥22,205 million of the ¥25,861 million reportable-segment business profit, about 86%. The segment figures include intersegment sales, and the adjustment line takes ¥604 million off segment profit against ¥903 million a year earlier.
By region, North America dominates. Overseas revenue there rose 18.5% to ¥110,322 million (7.2% excluding currency). North American soy sauce revenue rose 16.8% to ¥27,941 million (5.6% excluding currency), which the filing attributes to household soy sauce and soy-sauce-based seasonings and to a tailored approach for processing and food-service customers, while North American wholesale business profit rose 40.6% to ¥7,882 million (27.2% excluding currency) — for wholesale the filing says only that sales grew in every region. Europe grew 20.3% to ¥22,169 million (6.9% excluding currency), with soy sauce sales up in Italy, the Netherlands and Spain. Asia-Oceania is the exception: revenue rose 12.6% to ¥24,738 million as reported but fell 0.9% excluding currency. The filing reports soy sauce growth in Thailand, Malaysia and China, yet the region's soy sauce revenue was down 0.4% at constant currency, and Del Monte — canned fruit, corn products and ketchup made and sold in the region — fell 4.6% to ¥2,205 million, or 13.0% excluding currency.
At home, soy milk carried the growth
Domestic Food Manufacturing & Sales grew revenue 5.1% to ¥42,033 million and business profit 14.2% to ¥2,886 million, and one category accounts for most of it: beverages rose 14.0% to ¥14,024 million, supplying ¥1,725 million of the segment's ¥2,042 million increase. Within that, soy-milk drinks rose 13.5% to ¥10,341 million, which the company ties to health, protein and beauty-conscious demand and to heavy advertising, with plain, unadjusted soy milk particularly strong; Del Monte tomato juice and fruit drinks also sold well. The other categories barely moved. Soy sauce rose 1.2% to ¥11,359 million, as the household fresh-keeping bottle series grew while PET-bottle products declined and processing and food-service sales were flat. Foods rose 1.3% to ¥14,177 million on tsuyu soup bases and tare sauces, and mirin and wine were flat at ¥2,533 million, with mirin up and wine down.
Domestic Others — clinical-diagnostic enzymes and hygiene test reagents, hyaluronic acid, real-estate leasing, transport and shared services for the group — grew revenue 10.5% to ¥5,970 million and business profit 60.4% to ¥768 million, with the enzymes, reagents, hyaluronic acid and transport all ahead of last year. Taken together, the domestic businesses produced ¥3,660 million of business profit, up 21.6%, against ¥22,140 million overseas, up 27.8%.
A lighter cash pile, a heavier equity line
Total assets were ¥756,508 million at June 30, 2026, up 0.6% from ¥751,660 million at March 31; the company's own figures show them down ¥1,393 million excluding currency. Cash and cash equivalents fell ¥18,539 million to ¥93,230 million in a quarter in which ¥13,916 million of dividends went to owners of the parent, while inventories rose ¥5,988 million to ¥116,346 million and property, plant and equipment ¥8,595 million to ¥250,652 million. Liabilities fell ¥8,586 million to ¥174,231 million, mainly in trade payables and other current liabilities. Total equity rose to ¥582,277 million on retained earnings and on larger translation differences for overseas operations as the yen weakened, and the ratio of equity attributable to owners of the parent to total assets rose from 74.6% to 75.9%.
That translation effect also explains the comprehensive-income line. Other comprehensive income was +¥8,334 million against −¥5,682 million, including translation differences of +¥6,069 million against −¥6,459 million, so comprehensive income rose 181.8% to ¥27,554 million. No quarterly cash-flow statement was prepared; depreciation and amortisation was ¥7,278 million, up 12.9%. Treasury stock was essentially unchanged at 42,872,742 shares against 42,876,345 at March 31.
Guidance and dividend unchanged, with the quarter ahead on profit
Kikkoman left its FY3/2027 guidance unchanged from the figures published on April 24, 2026: revenue of ¥799,100 million (+7.2%), business profit of ¥82,300 million (+3.5%), operating profit of ¥78,800 million (+3.8%), pre-tax profit of ¥84,400 million (+0.4%) and attributable profit of ¥61,300 million (−0.5%), for earnings of ¥66.16 per share. The first quarter delivered 25.3% of guided revenue but 30.7% of guided business profit and 31.0% of guided attributable profit. Set against FY3/2026's actual business profit of ¥79,512 million, the guidance leaves ¥57,044 million for the remaining nine months, against ¥59,980 million in the same nine months a year earlier — a decline of about 4.9% — and the filing gives no reason for leaving it in place. It describes a world economy still recovering gradually, with weakness in some regions, and continuing uncertainty led by the Middle East situation.
The dividend forecast was also unchanged at ¥25.00 for the year — ¥10.00 at the interim and ¥15.00 at the year-end — matching FY3/2026 and equal to about 37.8% of guided earnings per share.
| Metric | Q1 FY3/2027 | Q1 FY3/2026 | Change |
|---|---|---|---|
| Revenue (¥ million) | 202,032 | 175,660 | +15.0% |
| Gross profit (¥ million) | 71,684 | 60,181 | +19.1% |
| Gross margin | 35.5% | 34.3% | +1.2 pt |
| SG&A expenses (¥ million) | 46,428 | 40,649 | +14.2% |
| Business profit (¥ million) | 25,256 | 19,532 | +29.3% |
| Business profit margin | 12.5% | 11.1% | +1.4 pt |
| Operating profit (¥ million) | 24,627 | 19,091 | +29.0% |
| Pre-tax profit (¥ million) | 26,166 | 21,084 | +24.1% |
| Net profit attrib. to owners of parent (¥ million) | 19,017 | 15,293 | +24.3% |
| EPS (¥) | 20.53 | 16.24 | +26.4% |
| Comprehensive income (¥ million) | 27,554 | 9,778 | +181.8% |
| Domestic Food Manufacturing & Sales — revenue (¥ million) | 42,033 | 39,990 | +5.1% |
| Domestic Food Manufacturing & Sales — business profit (¥ million) | 2,886 | 2,527 | +14.2% |
| Domestic Others — revenue (¥ million) | 5,970 | 5,400 | +10.5% |
| Domestic Others — business profit (¥ million) | 768 | 478 | +60.4% |
| Overseas Food Manufacturing & Sales — revenue (¥ million) | 48,231 | 41,996 | +14.8% |
| Overseas Food Manufacturing & Sales — business profit (¥ million) | 12,810 | 11,030 | +16.1% |
| Overseas Food Wholesale — revenue (¥ million) | 117,119 | 99,168 | +18.1% |
| Overseas Food Wholesale — business profit (¥ million) | 9,395 | 6,400 | +46.8% |
| Total assets (¥ million) | 756,508 | 751,660 | +0.6% |
| Cash and cash equivalents (¥ million) | 93,230 | 111,770 | −16.6% |
| Equity attrib. to owners of parent (¥ million) | 574,233 | 560,924 | +2.4% |
| Equity ratio | 75.9% | 74.6% | +1.3 pt |
| FY3/2027 guidance — revenue (¥ million) | 799,100 | — | +7.2% |
| FY3/2027 guidance — business profit (¥ million) | 82,300 | — | +3.5% |
| FY3/2027 guidance — operating profit (¥ million) | 78,800 | — | +3.8% |
| FY3/2027 guidance — pre-tax profit (¥ million) | 84,400 | — | +0.4% |
| FY3/2027 guidance — net profit (¥ million) | 61,300 | — | −0.5% |
| FY3/2027 guidance — EPS (¥) | 66.16 | — | n.m. |
| Annual dividend per share (¥) | 25.00 | 25.00 | unchanged |
JapanStockPulse provides informational content only and does not constitute investment advice. Figures are taken from the company's published earnings short report and may be subject to subsequent revision.