Sales grew 6.2%, but costs grew faster
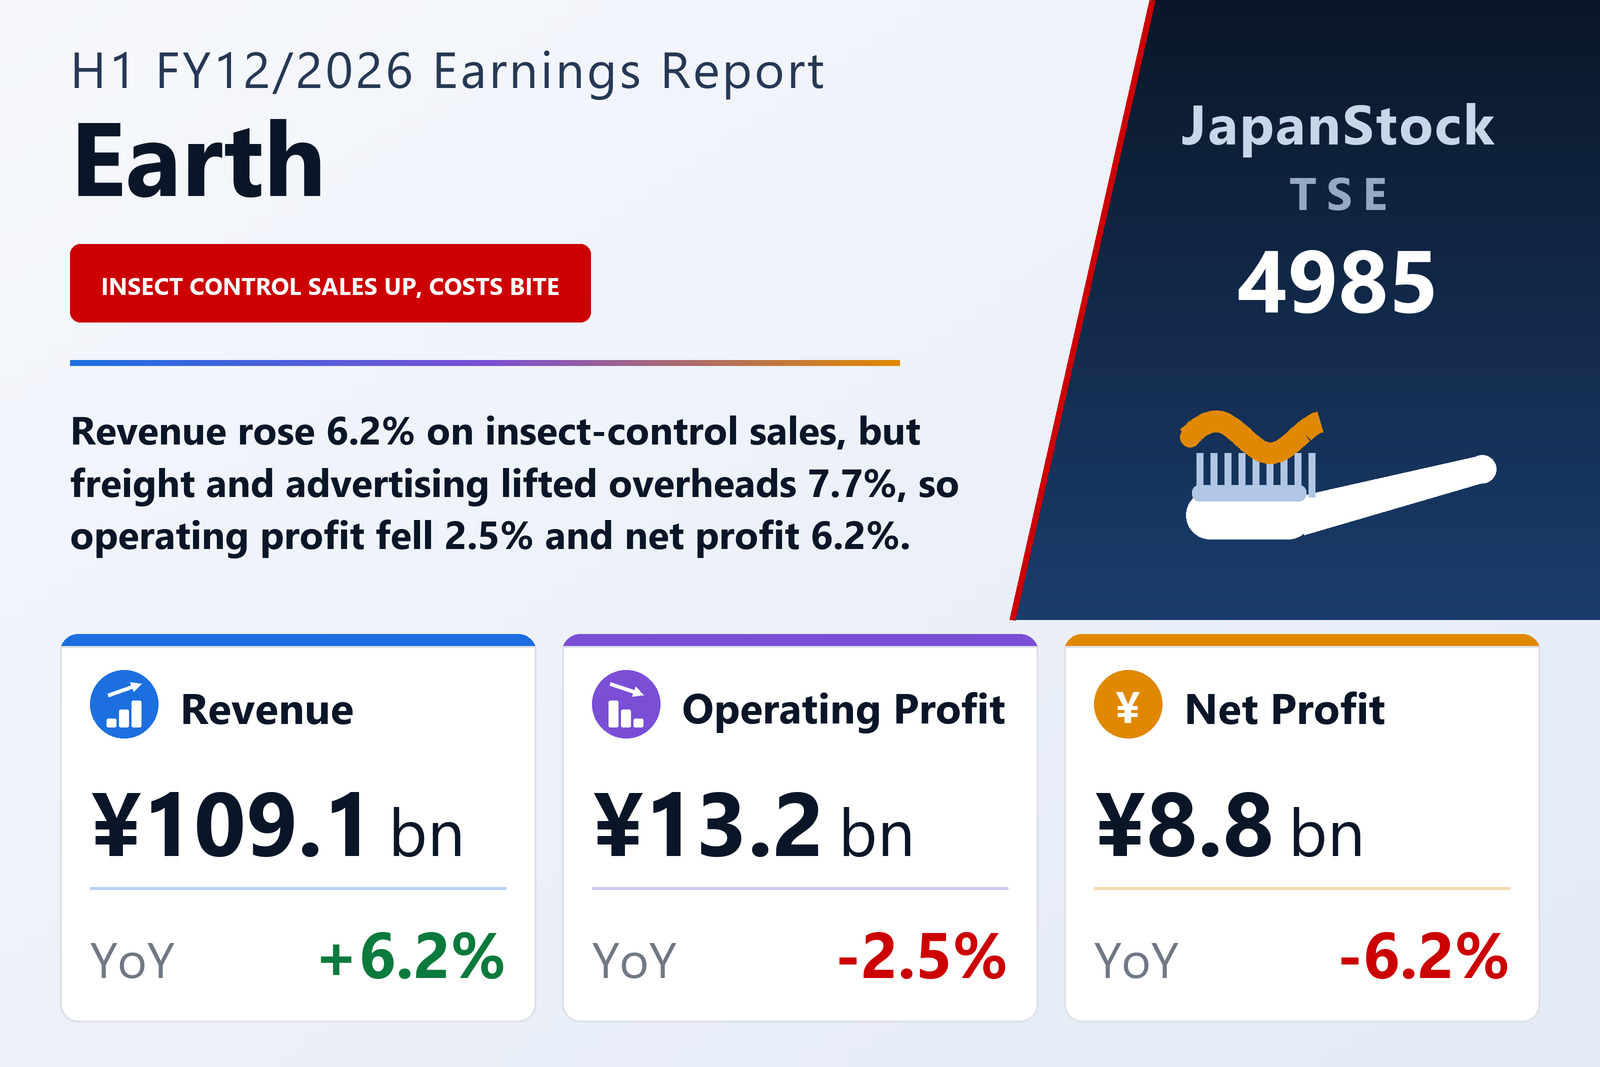
Earth Corporation (TSE: 4985), the maker of insect-control, oral-care, bath and other household products, published consolidated first-half results for FY12/2026, covering the six months from January 1 to June 30, 2026, on August 6, 2026 under Japanese GAAP. Revenue rose 6.2% to ¥109,055 million, but operating profit fell 2.5% to ¥13,219 million, ordinary profit 1.3% to ¥13,484 million and profit attributable to owners of the parent 6.2% to ¥8,795 million, for earnings of ¥402.09 per share against ¥430.03. The company is listed on the Tokyo Stock Exchange.
The arithmetic of the half is short. Cost of sales rose 7.5% to ¥61,823 million, faster than revenue, so gross profit grew only 4.6% to ¥47,231 million and the gross margin narrowed from 44.0% to 43.3%. Selling, general and administrative expenses rose 7.7% to ¥34,012 million. Gross profit therefore added ¥2,084 million while SG&A added ¥2,419 million, and the ¥335 million difference is exactly the fall in operating profit, from ¥13,554 million to ¥13,219 million. The operating margin slipped from 13.2% to 12.1%. The company's own summary puts it the same way: higher sales lifted gross profit, but SG&A rose by more, led by logistics and advertising costs.
Freight and advertising account for most of the cost increase
The expense lines bear out that explanation. Freight and storage costs rose 18.3% to ¥5,038 million from ¥4,259 million, and advertising 20.4% to ¥5,684 million from ¥4,719 million. Together those two lines added ¥1,744 million, about 72% of the ¥2,419 million rise in SG&A. Sales-promotion expenses also increased, to ¥828 million from ¥553 million, while the largest single line, salaries and allowances, grew a more modest 4.4% to ¥9,133 million and research and development 4.1% to ¥1,685 million. The filing does not break the freight increase down further, and it does not say whether the heavier advertising was tied to particular launches.
Below the operating line, currency helped and one-off items hurt
Ordinary profit fell less than operating profit, 1.3% against 2.5%, because the non-operating balance improved. The half booked a foreign-exchange gain of ¥54 million against an exchange loss of ¥226 million a year earlier, taking non-operating income to ¥553 million from ¥461 million, and non-operating expenses eased to ¥289 million from ¥357 million even though they included a ¥140 million compensation payment that the filing does not explain. Further down, the order reverses. A year earlier the group recorded ¥392 million of extraordinary gains, chiefly a ¥349 million gain on a step acquisition; this half there were effectively none. Extraordinary losses rose to ¥427 million from ¥310 million, made up mainly of ¥320 million of special retirement payments, for which no reason is given, and an ¥85 million impairment tied to the liquidation of a consolidated subsidiary in Suzhou, China. The prior-year losses had included a ¥289 million impairment of goodwill that arose from additional acquisition consideration paid for the Philippine subsidiary.
Pre-tax profit fell 5.0% to ¥13,057 million, income taxes 2.9% to ¥3,968 million — an effective rate of about 30.4% against 29.7% — and interim net profit 5.9% to ¥9,089 million. With non-controlling interests taking ¥293 million against ¥277 million, profit attributable to owners fell 6.2%, and earnings per share fell slightly more, 6.5%, on an average share count of 21,874,430 against 21,804,235. Comprehensive income was ¥8,740 million, down 1.2%.
Insect control carried the household segment
Both reporting segments grew revenue, but only the smaller one grew profit. Household Products recorded revenue of ¥97,675 million, up 5.8%, and segment operating profit of ¥12,257 million, down 1.8%, which the filing attributes to higher cost of sales and higher SG&A such as logistics and advertising. Environmental Hygiene grew revenue 7.7% to ¥18,189 million and profit 9.1% to ¥968 million. The segment figures include intersegment sales of ¥6,809 million, which is why they add to ¥115,865 million against group revenue of ¥109,055 million. On that basis Household Products is about 84% of segment revenue and about 93% of segment profit, so its 1.8% decline set the direction for the group.
Within Household Products, the Insect Control division was the engine: revenue rose 9.1% to ¥51,721 million, about 53% of the segment. In Japan, the filing says a run of cool days in mid-June held demand back, but strong sales at the start of the season kept the division on track across the half, with fly and mosquito products — including a product launched this spring — cockroach products and nuisance-insect products all selling well. Abroad, sales in Thailand were below the prior year, although the company says its market share there expanded, while Malaysia and the Philippines sold well. The filing describes these sales in terms of an insect season whose opening weeks fell in this half; this report does not quantify how the full year's insect-control sales divide between the two halves.
The other divisions were mixed. Daily Goods slipped 0.3% to ¥33,319 million. Inside it, oral care rose 5.8% to ¥4,260 million on the Mondahmin series, which was substantially renewed last year; bath additives fell 6.4% to ¥10,548 million as core products such as BARTH did well but powder-type products declined, and as internal sales disappeared with the absorption of the subsidiary Bathclin on January 1, 2026; and other daily goods, such as deodorisers, air fresheners and anti-mould products, rose 2.2% to ¥18,509 million. Gardening Products grew 23.6% to ¥6,514 million, helped by Protoleaf, consolidated from the previous fiscal year, and by garden insect-control products and herbicides. Pet Products and Other fell 1.8% to ¥6,119 million: cat litter and functional pet food grew, but sales related to MA-T, while on plan, were below the prior year. These division figures include internal sales within and between segments.
Environmental Hygiene provides hygiene-management services to food and pharmaceutical plants and other customers. The filing says demand remained high, supported by a recovery in manufacturing capital spending and by continuing foreign-matter contamination problems in Japan that are pushing customers to tighten hygiene control. Revenue grew on a larger number of annual contracts. A higher cost ratio and higher personnel costs from investment in staff weighed on profit, but the gross profit from higher sales more than offset them.
Receivables swelled and operating cash flow turned negative
Total assets rose 11.3% to ¥166,272 million from ¥149,382 million at December 31, 2025, and the filing attributes the increase mainly to trade receivables. Notes and accounts receivable plus electronically recorded receivables came to ¥46,095 million against ¥25,941 million, while cash and deposits fell to ¥20,542 million from ¥23,327 million and inventories eased to ¥31,399 million from ¥32,303 million. Liabilities rose ¥10,761 million to ¥78,854 million, including a ¥4,000 million increase in short-term borrowings to ¥11,420 million and income taxes payable of ¥4,940 million against ¥850 million. Net assets rose 7.5% to ¥87,417 million, with equity of ¥81,024 million, and the equity ratio fell 1.4 points to 48.7%.
The receivables build shows up in the cash-flow statement. Operating activities used ¥531 million, against an inflow of ¥3,272 million a year earlier: pre-tax profit of ¥13,057 million and depreciation of ¥2,403 million were more than absorbed by a ¥20,141 million increase in receivables (¥16,720 million a year earlier), along with ¥692 million of income taxes paid and ¥485 million of special retirement payments. Investing activities used ¥3,045 million, including ¥1,844 million for property, plant and equipment, ¥839 million for shares of affiliated companies and ¥529 million for intangible assets. Financing activities provided ¥915 million, as a net ¥4,000 million increase in short-term borrowings more than covered ¥2,730 million of dividends. Cash and cash equivalents fell ¥2,388 million to ¥20,542 million. The filing does not comment on the timing of the receivables increase, which on its own exceeded the half's pre-tax profit.
Guidance unchanged — and it implies a second-half operating loss
Earth left unchanged the full-year FY12/2026 guidance it published on February 13, 2026: revenue of ¥188,000 million (+4.9%), operating profit of ¥9,000 million (+11.3%), ordinary profit of ¥9,550 million (+7.4%) and profit attributable to owners of ¥6,200 million (+18.4%), for earnings of ¥283.79 per share. Set against the half just reported, the first half delivered 58.0% of guided revenue but 146.9% of guided operating profit and 141.9% of guided net profit. Guidance therefore implies second-half revenue of about ¥78,945 million with an operating loss of about ¥4,219 million and a loss attributable to owners of about ¥2,595 million. The same shape can be read from the prior year: the guided 11.3% increase implies FY12/2025 operating profit of roughly ¥8,100 million, well below the ¥13,554 million earned in the first half of that year, so the second half of FY12/2025 also closed with an operating loss, of roughly ¥5,500 million. The filing itself does not discuss how profit divides between the two halves; it says only that the forecast rests on information currently available.
The dividend forecast was also left unchanged. As a year earlier, no interim dividend was paid; the year-end dividend is forecast at ¥130.00 against ¥125.00, up 4.0%, or about 46% of guided earnings per share. The backdrop the company describes is mixed: in Japan, real wages trended positive and consumption showed a gradual pickup, but consumer sentiment stayed weak amid persistent inflation, while abroad oil prices, which spiked in February 2026, remained unstable, alongside the prolonged situation in Russia and Ukraine and caution over U.S. trade policy. Under its medium-term plan, Act For SMILE COMPASS 2026, Earth says it is prioritising profit and cash generation through domestic structural reform and stronger daily-goods brands, and treating expansion in Asia through local subsidiaries and exports to markets such as the Middle East as its growth drivers.
| Metric | H1 FY12/2026 | H1 FY12/2025 | Change |
|---|---|---|---|
| Revenue (¥ million) | 109,055 | 102,669 | +6.2% |
| Gross profit (¥ million) | 47,231 | 45,147 | +4.6% |
| Gross margin | 43.3% | 44.0% | −0.7 pt |
| SG&A expenses (¥ million) | 34,012 | 31,593 | +7.7% |
| Operating profit (¥ million) | 13,219 | 13,554 | −2.5% |
| Operating margin | 12.1% | 13.2% | −1.1 pt |
| Ordinary profit (¥ million) | 13,484 | 13,658 | −1.3% |
| Pre-tax profit (¥ million) | 13,057 | 13,740 | −5.0% |
| Net profit attrib. to owners of parent (¥ million) | 8,795 | 9,376 | −6.2% |
| EPS (¥) | 402.09 | 430.03 | −6.5% |
| Comprehensive income (¥ million) | 8,740 | 8,849 | −1.2% |
| Household Products — revenue (¥ million) | 97,675 | 92,305 | +5.8% |
| Household Products — segment profit (¥ million) | 12,257 | 12,480 | −1.8% |
| Environmental Hygiene — revenue (¥ million) | 18,189 | 16,889 | +7.7% |
| Environmental Hygiene — segment profit (¥ million) | 968 | 887 | +9.1% |
| Insect Control division — revenue (¥ million) | 51,721 | 47,397 | +9.1% |
| Daily Goods division — revenue (¥ million) | 33,319 | 33,405 | −0.3% |
| Gardening Products division — revenue (¥ million) | 6,514 | 5,269 | +23.6% |
| Pet Products & Other division — revenue (¥ million) | 6,119 | 6,233 | −1.8% |
| Operating cash flow (¥ million) | −531 | 3,272 | n.m. |
| Total assets (¥ million) | 166,272 | 149,382 | +11.3% |
| Net assets (¥ million) | 87,417 | 81,290 | +7.5% |
| Equity ratio | 48.7% | 50.2% | −1.4 pt |
| FY12/2026 guidance — revenue (¥ million) | 188,000 | — | +4.9% |
| FY12/2026 guidance — operating profit (¥ million) | 9,000 | — | +11.3% |
| FY12/2026 guidance — ordinary profit (¥ million) | 9,550 | — | +7.4% |
| FY12/2026 guidance — net profit (¥ million) | 6,200 | — | +18.4% |
| FY12/2026 guidance — EPS (¥) | 283.79 | — | — |
| Annual dividend per share (¥) | 130.00 | 125.00 | +4.0% |
JapanStockPulse provides informational content only and does not constitute investment advice. Figures are taken from the company's published earnings short report and may be subject to subsequent revision.