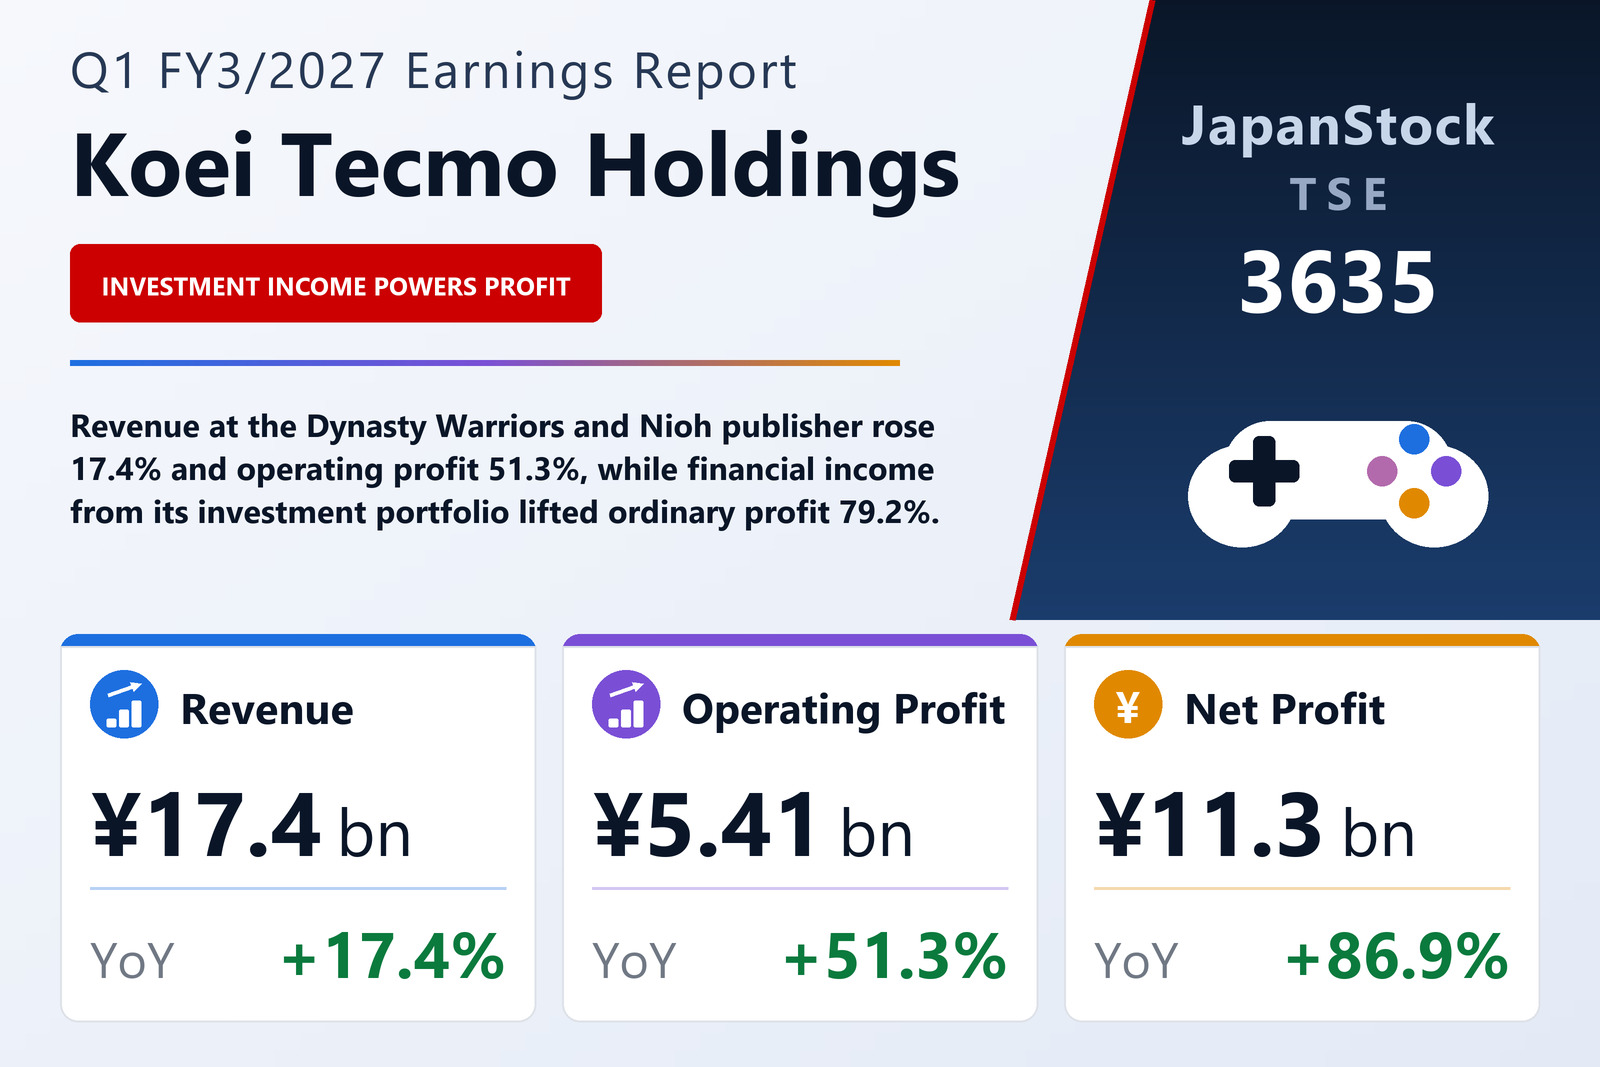
Koei Tecmo Holdings Co., Ltd. (TSE: 3635), the Yokohama-based developer and publisher behind the Dynasty Warriors, Nioh and Atelier franchises, reported consolidated results for the first quarter of the fiscal year ending March 2027 — the three months from 1 April to 30 June 2026 — under Japanese GAAP. Revenue rose 17.4% to ¥17,368 million, operating profit climbed 51.3% to ¥5,407 million, ordinary profit surged 79.2% to ¥15,719 million, and net profit attributable to owners of the parent jumped 86.9% to ¥11,348 million. Basic earnings per share were ¥33.97, up from ¥19.23 a year earlier. Diluted EPS is not disclosed for the quarter because the potential shares outstanding are anti-dilutive.
Game sales rebound
The top line recovered against a weak comparison: revenue in the year-earlier first quarter had fallen 15.9% to ¥14,800 million. This time the games business delivered a 17.4% increase, and the operating line geared up far more sharply — operating profit of ¥5,407 million was 51.3% above the ¥3,574 million booked a year ago. That lifted the quarterly operating margin to roughly 31%, from about 24% in the same quarter of FY3/2026, reflecting the high incremental margin of packaged and digital software once development costs have been absorbed.
Investment portfolio does the heavy lifting
The most striking feature of the quarter sits below the operating line. Ordinary profit of ¥15,719 million was nearly three times the ¥5,407 million operating profit, the gap accounted for almost entirely by non-operating financial income generated by the group's securities holdings. Comprehensive income, which also captures unrealised valuation movements on those holdings, reached ¥29,438 million, up 78.5% from ¥16,495 million.
This is a long-standing feature of the Koei Tecmo model rather than a one-off. The company runs a large in-house investment portfolio alongside its game business, and in strong market quarters the financial income it throws off can exceed the profit generated by publishing software. The corollary is that the group's ordinary and net profit lines are materially more volatile than its operating profit, and swing with markets as much as with release schedules.
A fortress balance sheet
Total assets stood at ¥333,923 million at 30 June 2026, up from ¥313,662 million three months earlier, while net assets rose to ¥279,963 million from ¥272,536 million. The equity ratio was 83.6%, against 86.7% at the end of March, and book value per share improved to ¥835.72 from ¥813.60. The group carries essentially no leverage of consequence, which is what allows it to hold an investment book of this scale in the first place.
Guidance implies a softer year
Management left its previously announced full-year forecast unchanged. For the first half it guides revenue of ¥34,000 million (+8.7%), operating profit of ¥7,000 million (−12.1%), ordinary profit of ¥12,000 million (−32.6%) and net profit of ¥9,000 million (−33.2%), with EPS of ¥27.69. For the full year to March 2027 it guides revenue of ¥90,000 million (+1.8%), operating profit of ¥32,000 million (−13.9%), ordinary profit of ¥42,000 million (−26.3%) and net profit of ¥31,000 million (−27.6%), for EPS of ¥95.38.
The first quarter alone therefore already covers about 37% of the full-year net-profit target, which implies a considerably weaker balance of the year on the company's own numbers. The main reason is the treatment of investment income: because it is inherently volatile, management does not assume that a quarter as strong as this one repeats. The dividend forecast is also unchanged, at ¥48.00 per share for FY3/2027 — all paid at year-end, with no interim distribution — down from ¥66.00 for FY3/2026.
| Metric | Q1 FY3/2027 | Q1 FY3/2026 | YoY |
|---|---|---|---|
| Revenue (¥ billion) | 17.37 | 14.80 | +17.4% |
| Operating profit (¥ billion) | 5.41 | 3.57 | +51.3% |
| Ordinary profit (¥ billion) | 15.72 | 8.77 | +79.2% |
| Net profit attrib. to owners (¥ billion) | 11.35 | 6.07 | +86.9% |
| Basic EPS (¥) | 33.97 | 19.23 | +76.6% |
| Comprehensive income (¥ billion) | 29.44 | 16.50 | +78.5% |
| FY27 net profit guidance (¥ billion) | 31.00 | 42.82 | -27.6% |
JapanStockPulse provides informational content only and does not constitute investment advice. Figures are taken from the company's published earnings short report and may be subject to subsequent revision.