Revenue and gross margin both up sharply
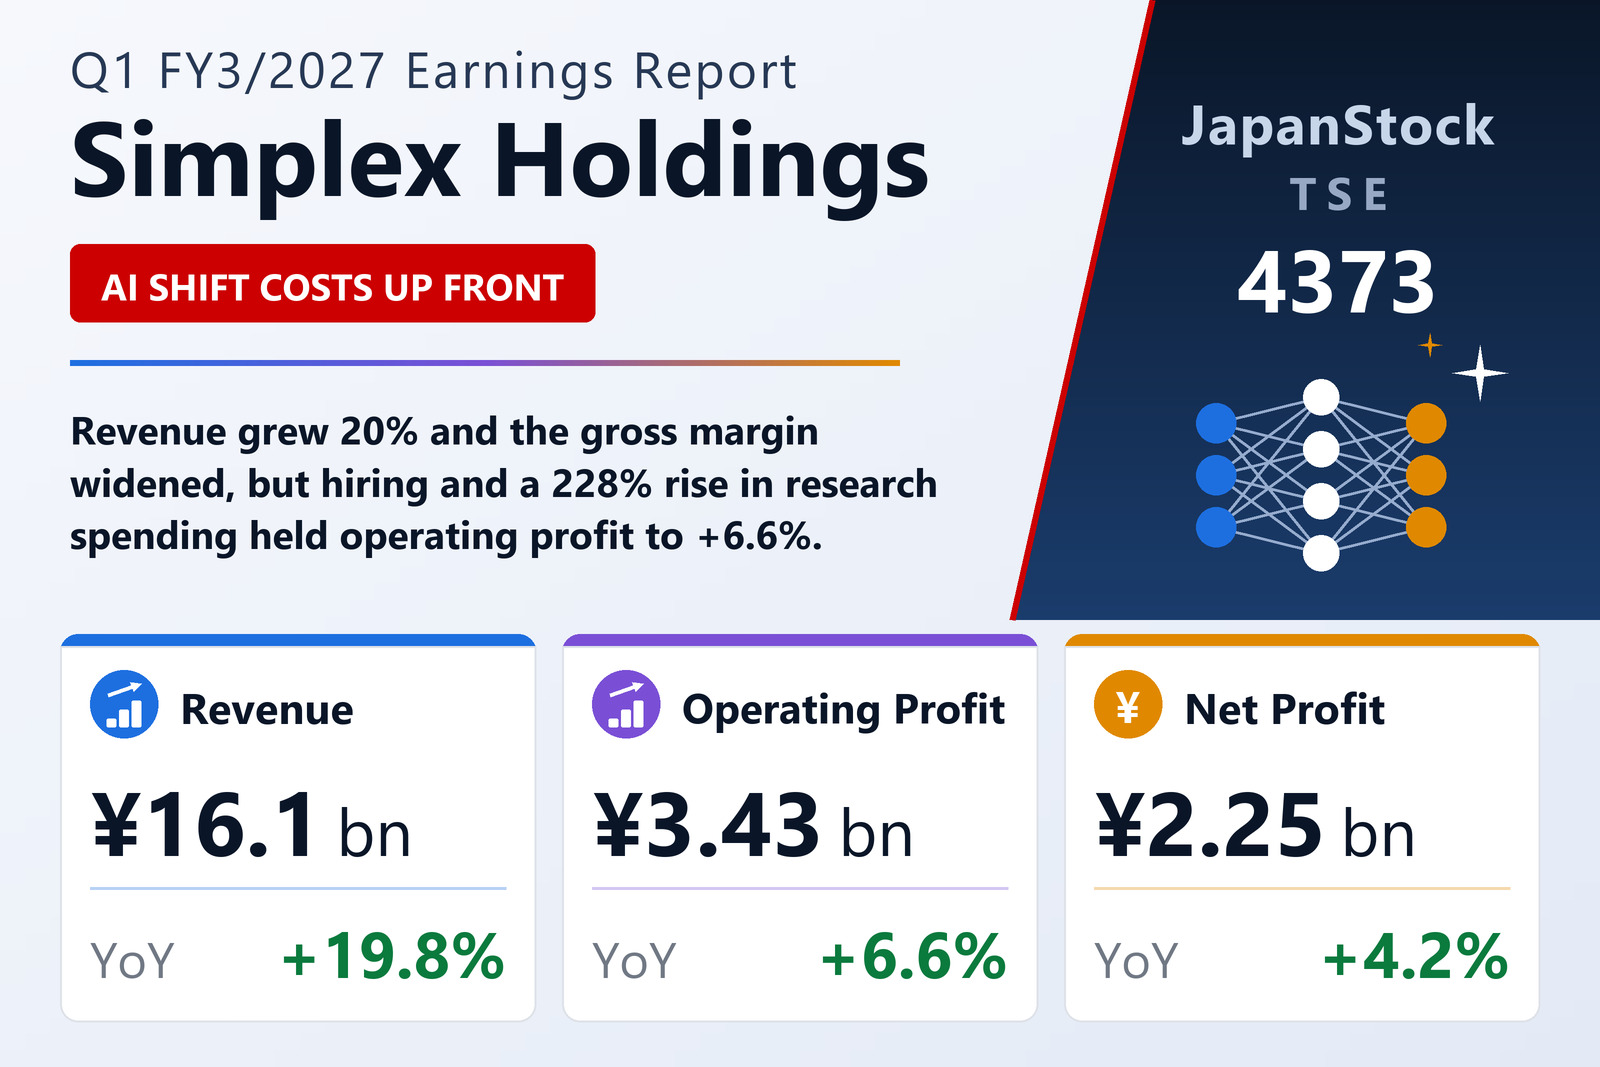
Simplex Holdings, Inc. (TSE: 4373) published consolidated results for the three months to June 30, 2026 on July 27, 2026 under IFRS. Revenue rose 19.8% to ¥16,135 million, gross profit 26.1% to ¥7,467 million and the gross margin widened to 46.3% from 44.0%. Operating profit rose 6.6% to ¥3,427 million, pre-tax profit 5.7% to ¥3,364 million and profit attributable to owners 4.2% to ¥2,249 million. Basic earnings per share were ¥10.05 against ¥9.50, restated for the four-for-one stock split effective December 1, 2025.
The gap between the 26.1% gross-profit gain and the 6.6% operating-profit gain sits entirely below the gross line. Selling, general and administrative expenses rose 31.5% to ¥3,263 million on stepped-up graduate and mid-career recruitment, and research spending rose 228.4% to ¥808 million from ¥246 million as the company standardises know-how and upgrades its development platform for a generative-AI-first way of building systems. The operating margin therefore narrowed to 21.2% from 23.9%.
System integration is the engine
By service line, system integration — 58.8% of revenue — grew 22.6% to ¥9,484 million with its gross margin up to 46.8% from 44.4%. Strategy and DX consulting grew 30.9% to ¥2,992 million at a 49.9% gross margin, the highest of the three, against 46.2% a year earlier. Operation services, the recurring base, grew 6.0% to ¥3,646 million at a broadly flat 41.8% margin. All three lines improved both revenue and margin year on year.
Balance sheet shrinks on payouts, not on trading
Total assets fell ¥6,676 million to ¥81,494 million, but the movement is seasonal rather than operational: trade receivables fell ¥3,803 million as customers paid, and cash went out on bonuses and income tax. Liabilities fell ¥4,966 million, with provisions down ¥2,603 million on bonus payments and income taxes payable down ¥1,504 million. Equity fell ¥1,710 million to ¥49,740 million, yet because assets shrank faster the owners' equity ratio rose to 61.0% from 58.4%. Operating cash flow was ¥1,357 million against ¥2,797 million a year earlier, investing used ¥169 million and financing used ¥4,521 million, of which ¥4,026 million was the dividend. Cash and equivalents ended at ¥11,112 million.
Guidance unchanged, dividend up a third
Simplex left the guidance published on April 30, 2026 in place: full-year revenue of ¥70,000 million (+19.3%), operating profit of ¥17,200 million (+19.3%), pre-tax profit of ¥16,943 million (+18.1%) and profit attributable to owners of ¥12,420 million (+17.9%), for basic earnings per share of ¥55.08. The first quarter therefore delivers 23.1% of the full-year revenue target and 19.9% of the operating-profit target — a first-quarter weighting the company's own half-year guidance of ¥7,350 million in operating profit already anticipates. The annual dividend forecast is ¥24.00, all payable at the year-end, against ¥18.00 for FY3/2026.
| Metric | Q1 FY3/2027 | Q1 FY3/2026 | Change |
|---|---|---|---|
| Revenue (¥ million) | 16,135 | 13,464 | +19.8% |
| Gross profit (¥ million) | 7,467 | 5,921 | +26.1% |
| Gross margin | 46.3% | 44.0% | +2.3 pt |
| SG&A expenses (¥ million) | 3,263 | 2,480 | +31.5% |
| Operating profit (¥ million) | 3,427 | 3,213 | +6.6% |
| Operating margin | 21.2% | 23.9% | -2.7 pt |
| Pre-tax profit (¥ million) | 3,364 | 3,181 | +5.7% |
| Net profit attrib. to owners of parent (¥ million) | 2,249 | 2,159 | +4.2% |
| Comprehensive income (¥ million) | 2,262 | 2,152 | +5.1% |
| EPS (¥) | 10.05 | 9.50 | +5.8% |
| Strategy/DX Consulting — revenue (¥ million) | 2,992 | 2,285 | +30.9% |
| System Integration — revenue (¥ million) | 9,484 | 7,733 | +22.6% |
| Operation Services — revenue (¥ million) | 3,646 | 3,439 | +6.0% |
| Total assets (¥ million) | 81,494 | 88,169 | -7.6% |
| Equity attrib. to owners of parent (¥ million) | 49,740 | 51,450 | -3.3% |
| Equity ratio | 61.0% | 58.4% | +2.6 pt |
| FY3/2027 guidance — revenue (¥ million) | 70,000 | — | +19.3% |
| FY3/2027 guidance — operating profit (¥ million) | 17,200 | — | +19.3% |
| FY3/2027 guidance — pre-tax profit (¥ million) | 16,943 | — | +18.1% |
| FY3/2027 guidance — net profit (¥ million) | 12,420 | — | +17.9% |
| FY3/2027 guidance — EPS (¥) | 55.08 | — | — |
| Annual dividend per share (¥) | 24.00 | 18.00 | +33.3% |
JapanStockPulse provides informational content only and does not constitute investment advice. Figures are taken from the company's published earnings short report and may be subject to subsequent revision.