Six months late, and with every prior-year figure restated
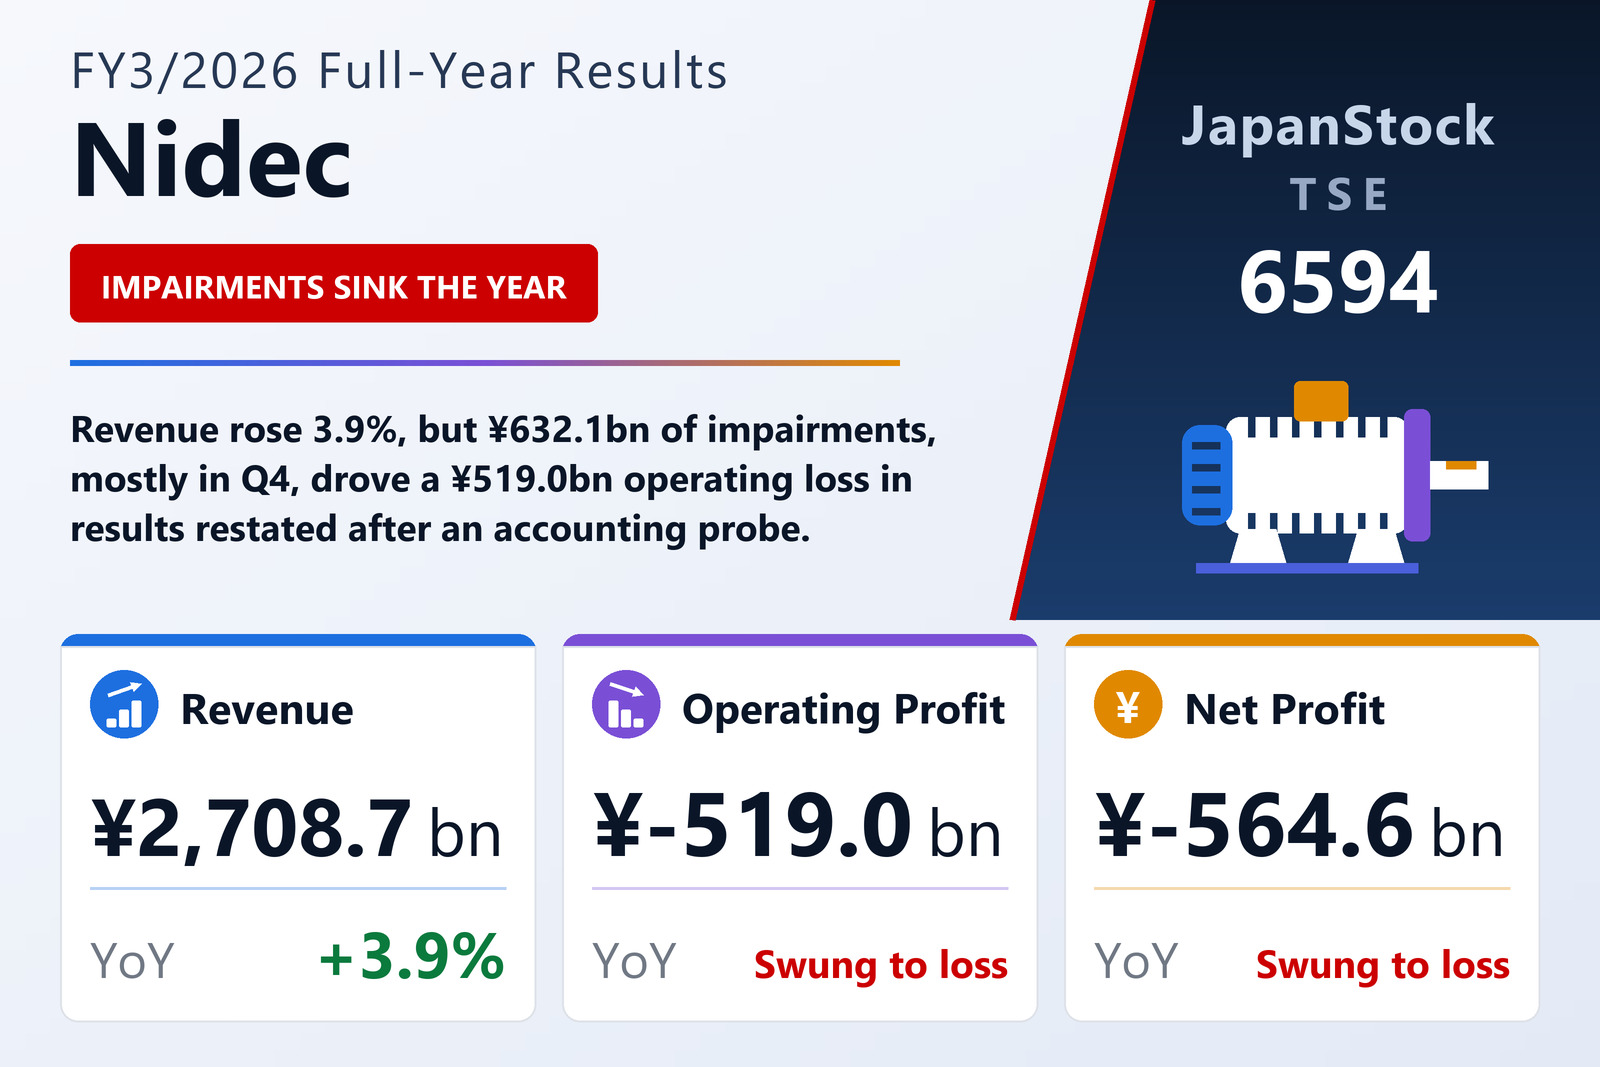
Nidec Corporation (TSE: 6594), the Kyoto-based maker of electric motors that range from precision spindle motors for hard-disk drives to automotive traction motors and large industrial drives, published consolidated results for the fiscal year from April 1, 2025 to March 31, 2026 on September 30, 2026 under IFRS. Revenue rose 3.9% to ¥2,708,705 million, but the year ended in an operating loss of ¥518,978 million against a ¥128,222 million profit, a pre-tax loss of ¥496,214 million, and a net loss attributable to owners of the parent of ¥564,624 million against a ¥84,672 million profit, or −¥492.55 per share against ¥73.69.
The timing and the comparisons both need reading carefully. The filing explains that Nidec set up a third-party committee on September 3, 2025 after identifying suspected improper accounting, received its report on February 27, 2026 and a final supplementary report on April 17, 2026. That report found numerous improper accounting treatments, through fraud and error, at many group locations, including early recognition of sales, under-provisioning, overstatement of inventories, avoidance of impairment of fixed assets and capitalisation of costs, carried out with the involvement or knowledge of management. Nidec has corrected the misstatements retroactively, so every FY3/2025 figure in this article is the restated number, not the one originally published.
The impairment is the whole story, and it landed in the fourth quarter
The operating line fell by ¥647.2 billion, and the filing attributes it to ¥632,135 million of impairment losses on non-financial assets recognised during the year. The notes itemise the six largest: ¥298.8 billion on the ACIM appliance-motor business, where excessive competition in China eroded competitiveness; ¥116.3 billion on Nidec-PSA emotors, reflecting slower EV growth; ¥73.1 billion on Nidec Mobility, tied to weaker profitability in North America; ¥56.1 billion on Nidec Instruments; ¥28.1 billion on Nidec Powertrain Systems; and ¥26.8 billion on Nidec Techno Motor. Together they account for ¥599.2 billion, much of it goodwill, machinery and trademarks. The charges fell almost entirely in the January–March quarter, which alone produced an operating loss of ¥634.7 billion; over the first nine months Nidec had been ¥115.7 billion in operating profit.
Underneath the write-downs, the trading picture weakened too. Gross profit fell 4.0% to ¥526,635 million despite higher revenue, taking the gross margin from 21.0% to 19.4%, and research and development spending rose 46.7% to ¥116,903 million. Selling, general and administrative expenses came to ¥928,710 million against ¥340,713 million. Below the operating line, a ¥14.7 billion foreign-exchange gain replaced an ¥11.9 billion loss, but income tax expense rose to ¥126,696 million from ¥45,167 million even though the group made a pre-tax loss; the balance sheet shows deferred tax assets falling to ¥24.0 billion from ¥50.1 billion and deferred tax liabilities rising to ¥117.6 billion from ¥60.9 billion, but the summary does not explain the charge. Non-controlling interests absorbed ¥58.3 billion of the ¥623.0 billion total loss, and ¥135.9 billion of currency-translation gains cut the comprehensive loss to ¥478,289 million.
Two of five product groups swing to heavy losses
By product group, Automotive grew revenue 7.7% to ¥718,309 million but posted an operating loss of ¥250,536 million against a ¥25,255 million profit, after ¥231.1 billion of impairments. Appliance, Commercial & Industrial, the largest group, grew 5.0% to ¥1,104,605 million on continued demand for data-centre backup generators and battery energy storage systems, but swung to an operating loss of ¥251,124 million from a ¥107,655 million profit after ¥335.1 billion of impairments. Small Precision Motors grew 2.2% to ¥498,696 million, with hard-disk-drive motors up 9.8% to ¥110,152 million, but its operating profit halved, down 51.3% to ¥29,995 million. Machinery slipped 3.8% to ¥298,782 million while cutting its operating loss to ¥930 million from ¥64,609 million, and Electronic & Optical Components earned ¥2,415 million, down 81.8%.
Equity down by a third; borrowings and cash both up sharply
Equity attributable to owners of the parent fell 35.9% to ¥794,164 million as retained earnings dropped by ¥580.8 billion, and the equity ratio fell to 25.6% from 42.5%. Total assets nonetheless rose 6.4% to ¥3,107,621 million, because cash and cash equivalents jumped by ¥606.0 billion to ¥852,204 million while goodwill fell ¥185.5 billion and property, plant and equipment ¥218.8 billion. The cash came largely from borrowing: short-term borrowings rose to ¥587.0 billion from ¥93.7 billion, taking interest-bearing debt to ¥1,113,405 million from ¥639,192 million. Net interest-bearing debt actually fell to ¥261.2 billion from ¥392.9 billion. Operating cash flow was ¥234.2 billion, down from ¥272.5 billion, and free cash flow ¥98.0 billion.
Special alert designation and the company's own caveat
The filing states that the Tokyo Stock Exchange designated Nidec's shares a Security on Special Alert from October 28, 2025, citing a disclaimer of audit opinion on its FY3/2025 annual securities report and material weaknesses in internal control. The designation runs in principle for one year, after which Nidec submits an internal-control confirmation report, which the filing says it plans to do at the end of October 2026; under the exchange's rules, the designation is lifted if no problems are found and, in principle, the shares are delisted if problems are found, with a possible extension if controls are in place but not yet operating effectively. Nidec also cautions that some officers and employees involved in the improper accounting still hold responsible positions in its financial-reporting process, and that undiscovered misstatements could have a material and pervasive effect on its financial statements that it cannot yet quantify and has not reflected.
Guidance and dividend
For the year to March 31, 2027, Nidec forecasts revenue of ¥2,800,000 million (+3.4%), operating profit of ¥200,000 million, pre-tax profit of ¥180,000 million and net profit attributable to owners of ¥100,000 million, or ¥87.23 per share, assuming ¥150 to the dollar and ¥180 to the euro. For the first half it expects revenue of ¥1,400,000 million and operating profit of ¥120,000 million. Nidec paid no dividend at either the interim or the year-end of FY3/2026, and both dividends for FY3/2027 are undecided.
| Metric | FY3/2026 | FY3/2025 | Change |
|---|---|---|---|
| Revenue (¥ million) | 2,708,705 | 2,606,347 | +3.9% |
| Gross profit (¥ million) | 526,635 | 548,627 | −4.0% |
| Gross margin | 19.4% | 21.0% | −1.6 pt |
| SG&A expenses (¥ million) | 928,710 | 340,713 | +172.6% |
| R&D expenses (¥ million) | 116,903 | 79,692 | +46.7% |
| Operating profit (¥ million) | −518,978 | 128,222 | profit to loss |
| Pre-tax profit (¥ million) | −496,214 | 124,576 | profit to loss |
| Net profit attrib. to owners of parent (¥ million) | −564,624 | 84,672 | profit to loss |
| EPS (¥) | −492.55 | 73.69 | profit to loss |
| Comprehensive income (¥ million) | −478,289 | 56,216 | profit to loss |
| Small Precision Motors — revenue (¥ million) | 498,696 | 487,994 | +2.2% |
| Small Precision Motors — segment profit (¥ million) | 29,995 | 61,651 | −51.3% |
| Automotive — revenue (¥ million) | 718,309 | 666,791 | +7.7% |
| Automotive — segment profit (¥ million) | −250,536 | 25,255 | profit to loss |
| Appliance, Commercial & Industrial — revenue (¥ million) | 1,104,605 | 1,052,308 | +5.0% |
| Appliance, Commercial & Industrial — segment profit (¥ million) | −251,124 | 107,655 | profit to loss |
| Machinery — revenue (¥ million) | 298,782 | 310,532 | −3.8% |
| Machinery — segment profit (¥ million) | −930 | −64,609 | loss narrowed |
| Electronic & Optical Components — revenue (¥ million) | 84,560 | 85,190 | −0.7% |
| Electronic & Optical Components — segment profit (¥ million) | 2,415 | 13,281 | −81.8% |
| Total assets (¥ million) | 3,107,621 | 2,919,765 | +6.4% |
| Equity attrib. to owners of parent (¥ million) | 794,164 | 1,239,815 | −35.9% |
| Equity ratio | 25.6% | 42.5% | −16.9 pt |
| Interest-bearing debt (¥ million) | 1,113,405 | 639,192 | +74.2% |
| FY3/2027 guidance — revenue (¥ million) | 2,800,000 | — | +3.4% |
| FY3/2027 guidance — operating profit (¥ million) | 200,000 | — | loss to profit |
| FY3/2027 guidance — pre-tax profit (¥ million) | 180,000 | — | loss to profit |
| FY3/2027 guidance — net profit (¥ million) | 100,000 | — | loss to profit |
JapanStockPulse provides informational content only and does not constitute investment advice. Figures are taken from the company's published earnings short report and may be subject to subsequent revision.