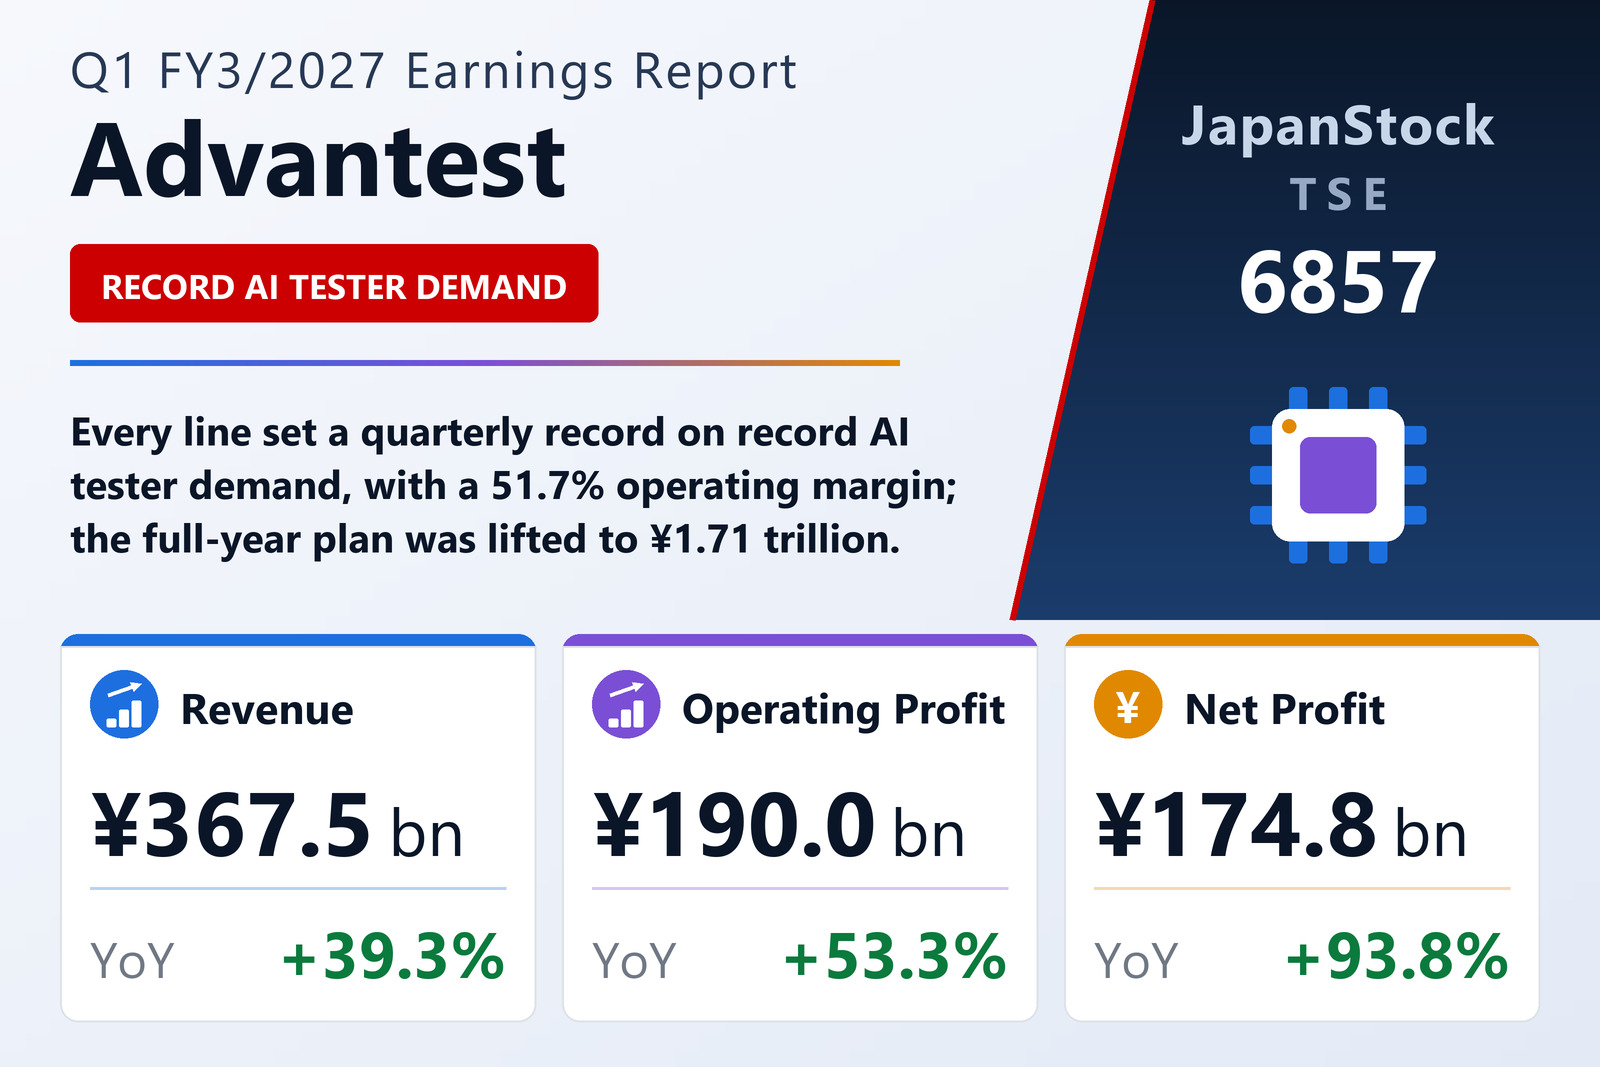
Advantest Corporation (TSE: 6857), the Tokyo-based manufacturer of automated test equipment for semiconductors, reported consolidated results for the first quarter of the fiscal year ending March 2027 — the three months from April 1 to June 30, 2026 — under IFRS. Revenue rose 39.3% to ¥367,473 million, operating profit climbed 53.3% to ¥189,990 million, profit before tax jumped 92.9% to ¥234,082 million, and quarterly profit attributable to owners of the parent nearly doubled, rising 93.8% to ¥174,780 million. The company stated that revenue, operating profit, profit before tax and quarterly profit were all quarterly records. Basic earnings per share were ¥241.27 against ¥123.14 a year earlier, and diluted EPS ¥239.89 against ¥122.80.
Records on every line, and a margin above 51%
Operating profit equalled 51.7% of revenue, up from 47.0% in the year-earlier quarter — an expansion of roughly 4.7 percentage points driven by the volume increase and by an improved sales mix, which management named as the two reasons profit outgrew sales. Comprehensive income more than tripled, rising 213.2% to ¥301,822 million from ¥96,381 million. That figure was inflated by other comprehensive income of ¥127,042 million after tax, of which ¥120,229 million was the net change in the fair value of financial assets measured at fair value through other comprehensive income and ¥6,944 million came from foreign-currency translation of overseas operations.
The ¥44.7 billion that flatters the pre-tax line
Pre-tax profit grew far faster than operating profit — up 92.9% against 53.3% — and the gap is almost entirely non-operational. During the quarter the group booked financial income of ¥44,680 million, of which ¥41,075 million was valuation gains on financial instruments tied to its strategic investments; financial costs were just ¥588 million. Readers should therefore treat the +92.9% pre-tax and +93.8% net growth rates as flattered by a mark-to-market item rather than as a measure of underlying operating momentum, which the 53.3% operating-profit gain captures more faithfully. A weaker yen also helped: the average rate was ¥159 to the U.S. dollar against ¥146 a year earlier and ¥185 to the euro against ¥162, and with an overseas sales ratio of 99.1% (98.6% a year earlier) almost the entire top line is exposed to that translation effect.
AI chip complexity drove the Test System division
Management described a world economy that stayed resilient, underpinned by expanding AI-related investment centred on the United States, even as geopolitical risk — including tension in the Middle East — raised uncertainty about the outlook. Against that backdrop the semiconductor market kept growing strongly, led by AI-related chips: data-centre HPC (High Performance Computing) devices and high-performance memory, as the AI technology race accelerated and real-world deployment advanced. Demand for the group's testers for AI-related high-performance semiconductors expanded sharply, because volumes of advanced AI chips rose while their complexity increased, and customers sustained aggressive capital investment as a result. Advantest said it worked to expand production capacity across its entire supply chain in order to meet that demand promptly.
In the Test System division, revenue rose 38.7% to ¥333,562 million and segment profit 50.3% to ¥190,722 million. SoC test systems saw a sharp increase in sales for high-performance SoC devices as volumes of increasingly complex AI and HPC chips expanded; memory test systems grew on the back of rising data-centre investment, led by high-performance DRAM with non-volatile memory sales also up. Device interfaces and test handlers rose in step with tester demand. The Services & Others division lifted revenue 46.0% to ¥33,911 million and segment profit 216.4% to ¥8,563 million, helped by a larger installed base driving support and service revenue and by higher sales of consumables such as test interface boards for high-performance SoC devices. The prior-year comparison is easy in that division: year-earlier segment profit had included a ¥2,504 million gain on a partial business transfer. Total segment profit of ¥191,341 million was reduced by ¥7,944 million of corporate and elimination items and by ¥1,351 million of share-based compensation expense to reach reported operating profit.
Investment securities swell the balance sheet
Total assets ended the quarter at ¥1,514,652 million, up from ¥1,171,816 million at the March 2026 year-end — a rise of ¥342.8 billion, driven by a ¥289.8 billion increase in investment securities, a ¥73.2 billion increase in cash and cash equivalents and a ¥41.9 billion increase in inventories, partly offset by a ¥50.2 billion fall in trade and other receivables. Total liabilities rose ¥95.9 billion to ¥472,010 million, mainly on ¥88.9 billion of additional bonds. Total equity reached ¥1,042,642 million from ¥795,726 million, and the ratio of equity attributable to owners of the parent improved 0.9 points to 68.8% from 67.9%. Operating cash flow was an inflow of ¥137,155 million against ¥46,851 million a year earlier, investing activities used ¥102,548 million — largely ¥87,817 million spent acquiring debt financial instruments — and financing activities provided ¥34,966 million, reflecting ¥100,000 million raised through a convertible bond issue against ¥42,211 million of share buybacks and ¥21,426 million of dividends paid. Cash and cash equivalents closed at ¥413,124 million.
Full-year plan lifted to ¥1.71 trillion, dividend forecast withheld
Citing a calendar-2026 semiconductor market expected to pass one trillion dollars, a record-sized semiconductor tester market, and test demand for inference AI chips running well above what the company assumed in April 2026, Advantest revised its full-year guidance upward and said it is pulling forward its own capacity expansion. Revenue guidance was raised from ¥1,420.0 billion to ¥1,714,000 million (+51.9% year on year), operating profit from ¥627.5 billion to ¥846,000 million (+69.5%), profit before tax from ¥629.0 billion to ¥891,000 million (+72.4%) and profit to ¥660,000 million (+75.8%), with guidance basic EPS of ¥911.64. The plan assumes ¥150 to the dollar and ¥170 to the euro for the remaining nine months — rates weaker than the quarter just reported but stronger than the ¥159 average actually realised. On dividends the company is explicit and unhelpful in equal measure: for the year to March 2026 it paid an interim of ¥29.00 and a year-end of ¥30.00 for an annual ¥59.00, but every cell of the FY3/27 dividend forecast row is a dash — no figure has been disclosed. Management added that the direct impact of the current Middle East situation is seen as limited for now, though some costs including logistics are expected to rise, and that demand for key components such as memory chips continues to exceed supply as AI investment broadens across industry.
| Metric | Q1 FY3/2027 | Q1 FY3/2026 | YoY |
|---|---|---|---|
| Revenue (¥ billion) | 367.47 | 263.78 | +39.3% |
| Operating profit (¥ billion) | 189.99 | 123.95 | +53.3% |
| Operating margin (%) | 51.7 | 47.0 | +4.7 pt |
| Profit before tax (¥ billion) | 234.08 | 121.36 | +92.9% |
| Quarterly profit attrib. to owners (¥ billion) | 174.78 | 90.18 | +93.8% |
| Comprehensive income (¥ billion) | 301.82 | 96.38 | +213.2% |
| Basic EPS (¥) | 241.27 | 123.14 | +95.9% |
| Diluted EPS (¥) | 239.89 | 122.80 | +95.4% |
| Test System — revenue (¥ billion) | 333.56 | 240.55 | +38.7% |
| Test System — segment profit (¥ billion) | 190.72 | 126.93 | +50.3% |
| Services & Others — revenue (¥ billion) | 33.91 | 23.22 | +46.0% |
| Services & Others — segment profit (¥ billion) | 8.56 | 2.71 | +216.4% |
| Financial income (¥ billion) | 44.68 | 0.69 | — |
| Total assets (¥ billion; vs Mar 31, 2026) | 1,514.65 | 1,171.82 | +29.3% |
| Total equity (¥ billion; vs Mar 31, 2026) | 1,042.64 | 795.73 | +31.0% |
| Equity ratio, owners of parent (%) | 68.8 | 67.9 | +0.9 pt |
| FY3/27 guidance — revenue (¥ billion) | 1,714.00 | — | +51.9% |
| FY3/27 guidance — operating profit (¥ billion) | 846.00 | — | +69.5% |
| FY3/27 guidance — profit (¥ billion) | 660.00 | — | +75.8% |
| FY3/27 guidance — basic EPS (¥) | 911.64 | — | — |
| Annual dividend (¥, FY3/27 forecast vs FY3/26 actual) | Not disclosed | 59.00 | — |
JapanStockPulse provides informational content only and does not constitute investment advice. Figures are taken from the company's published earnings short report and may be subject to subsequent revision.