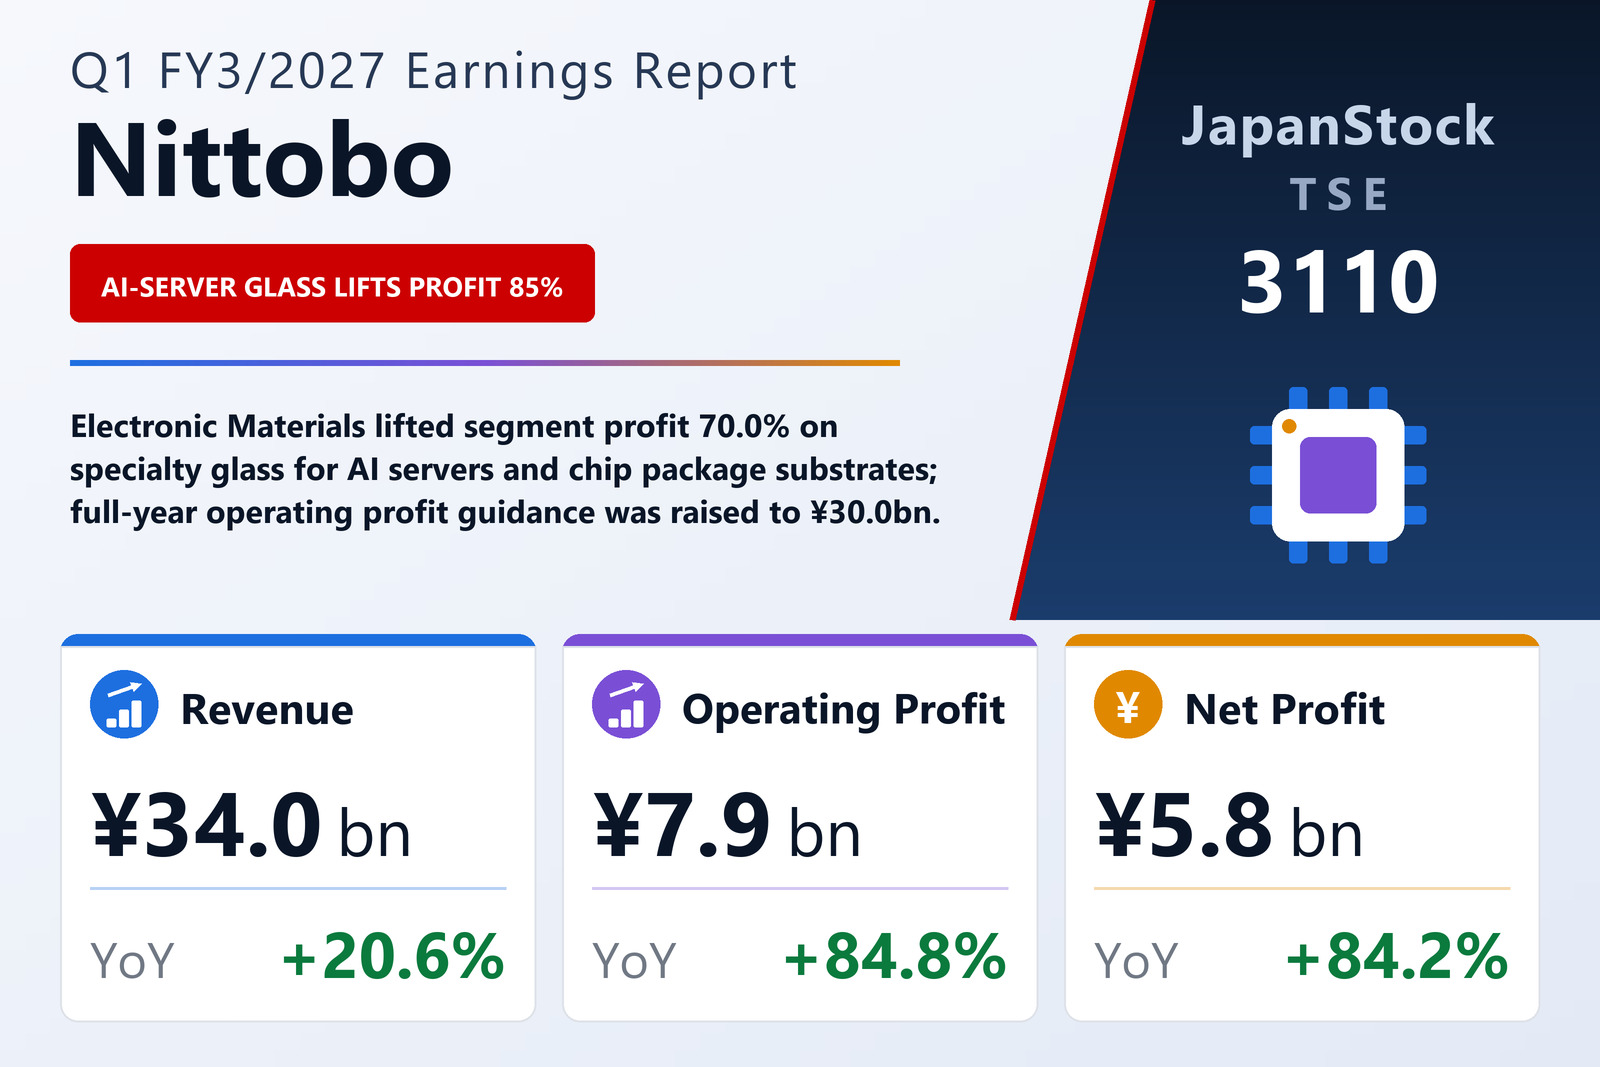
Revenue up a fifth, operating profit up 85%
Nitto Boseki Co., Ltd. (TSE: 3110), the glass-fibre group that trades as Nittobo and runs electronic materials, medical, composites, materials and chemicals, and insulation businesses, published consolidated results for the first quarter of the fiscal year ending March 2027 — the three months from April 1 to June 30, 2026 — on August 5, 2026, under Japanese GAAP. Revenue rose 20.6% to ¥34,033 million, operating profit 84.8% to ¥7,943 million, ordinary profit 94.1% to ¥8,433 million and profit attributable to owners of the parent 84.2% to ¥5,797 million. Earnings per share were ¥31.85 against ¥17.29, both calculated as if the five-for-one stock split carried out on July 1, 2026 had taken effect at the start of the previous fiscal year. The filing names the Tokyo Stock Exchange as its listing venue.
The company attributes the quarter to strong sales of high-value-added products, centred on its Electronic Materials business, and the cost lines show how that carried through. Cost of sales rose only 9.3% to ¥19,118 million against revenue growth of 20.6%, so gross profit rose 38.9% to ¥14,914 million and the gross margin widened from 38.0% to 43.8%. Selling, general and administrative expenses grew 8.2% to ¥6,971 million, far below the pace of revenue. Of the ¥5,802 million added to revenue, ¥4,175 million reached gross profit and ¥3,645 million reached operating profit, which is how the operating margin moved from 15.2% to 23.3% in a single year.
Below the operating line: a currency swing and a higher tax charge
Ordinary profit grew faster than operating profit, by 94.1% to ¥8,433 million, because the non-operating lines improved. Non-operating income rose from ¥542 million to ¥746 million, helped by a foreign-exchange gain of ¥246 million and interest income of ¥60 million against ¥4 million, even though rental income fell from ¥155 million to ¥21 million. Non-operating expenses fell from ¥496 million to ¥256 million, as the previous year's foreign-exchange loss of ¥182 million and ¥58 million of costs related to idle rental property did not recur. The currency line alone moved by ¥428 million between the two quarters.
Extraordinary items were small: gains of ¥7 million and losses on disposal of fixed assets of ¥82 million. Pre-tax profit rose 93.7% to ¥8,358 million. Income taxes more than doubled, from ¥1,059 million to ¥2,336 million, taking the tax charge to 27.9% of pre-tax profit from 24.5% a year earlier, which is why net profit grew a little more slowly than ordinary profit. Profit for the quarter was ¥6,021 million, of which ¥224 million belonged to non-controlling interests. Comprehensive income was ¥7,505 million against ¥825 million: the prior-year figure had been cut by a ¥2,783 million foreign-currency translation loss, while this year translation added ¥225 million and the valuation difference on securities added ¥1,324 million.
Electronic Materials delivered four fifths of the gain
Nittobo's segment note covers six businesses, including one labelled Other, and one of them dominated the quarter. Electronic Materials recorded sales to external customers of ¥14,589 million, up 29.5%, and segment profit of ¥7,036 million, up 70.0%. The segment was 42.9% of group revenue but 83.5% of the ¥8,429 million of segment profit before corporate adjustments, and its profit rose by ¥2,897 million — about four fifths of the ¥3,645 million increase in group operating profit. The filing's explanation is specific: demand linked to AI servers continued to expand, lifting sales of specialty glass with low-dielectric properties and of specialty glass with low thermal expansion for semiconductor package substrates, and price revisions also contributed to earnings.
Segment revenue figures in this article are sales to external customers, the basis the company's own commentary uses. Including intersegment transfers, Electronic Materials' sales were ¥18,082 million against ¥14,362 million. On the external basis the segment supplied ¥3,324 million of the ¥5,802 million increase in group revenue, or 57.3%.
Every other business grew, and two left last year's losses behind
Medical grew sales 6.8% to ¥3,818 million and segment profit 66.8% to ¥705 million, on strong sales of in-vitro diagnostic reagents such as immune-related and bone-metabolism markers. Insulation grew sales 24.2% to ¥4,399 million and turned a loss of ¥50 million into a profit of ¥251 million; the filing cites strong sales for both residential and non-residential buildings and the effect of price revisions. Materials & Chemicals grew sales 15.4% to ¥2,615 million on higher sales of glass fibre for industrial materials, and segment profit rose 103.3% to ¥222 million as price revisions outweighed cost increases from generally rising prices.
Composites grew sales 15.9% to ¥3,830 million and moved from a segment loss of ¥15 million to a segment profit of ¥0 million, that is, break-even; the filing says only that sales increased and contributed to earnings. The Other businesses grew sales 11.8% to ¥4,780 million and profit 90.8% to ¥213 million, without further explanation. Corporate costs not allocated to segments, together with eliminations, came to ¥486 million against ¥417 million. Depreciation, including amortisation of intangible assets, rose from ¥2,116 million to ¥2,505 million.
Cash and tax liabilities fell; inventories and equipment rose
Total assets were ¥280,413 million at June 30, 2026, down ¥2,624 million from March 31, 2026, which the company attributes mainly to lower cash and deposits; those fell from ¥62,014 million to ¥45,476 million. Liabilities fell ¥6,177 million to ¥96,477 million, mainly because income taxes payable dropped from ¥13,117 million to ¥1,832 million. Over the same three months inventories — merchandise and finished goods, work in process, and raw materials and supplies — rose from ¥59,076 million to ¥64,184 million, and machinery, equipment and vehicles from ¥38,099 million to ¥41,665 million. Net assets rose to ¥183,935 million and the equity ratio from 61.3% to 63.2%. The company did not prepare a quarterly cash-flow statement.
Guidance raised for the half and the full year
Citing the quarter's results and its outlook for the business environment, Nittobo raised its forecasts the same day. For the first half to September 30, 2026, it now expects revenue of ¥69,300 million (previously ¥67,900 million), operating profit of ¥15,300 million (¥12,600 million), ordinary profit of ¥15,500 million (¥12,600 million) and profit attributable to owners of the parent of ¥10,500 million (¥8,500 million). First-quarter operating profit of ¥7,943 million is 51.9% of the new first-half figure.
For the full year to March 31, 2027, the forecasts rise to revenue of ¥141,000 million from ¥137,000 million, operating profit of ¥30,000 million from ¥26,000 million, ordinary profit of ¥30,000 million from ¥26,000 million, and profit attributable to owners of the parent of ¥20,000 million from ¥17,000 million. Against FY3/2026 actuals, that means growth of 19.3% in revenue, 44.1% in operating profit and 39.2% in ordinary profit, but a 52.1% fall in net profit, because FY3/2026 net profit was ¥41,770 million — almost double that year's ordinary profit of ¥21,544 million. This filing does not explain the prior year's figure. Forecast earnings per share are ¥109.87, against ¥93.39 before the revision.
The July 1 split changes how the dividend reads. For FY3/2026 the company paid ¥27.50 at the interim and ¥99.50 at the year-end, ¥127.00 in all, on the pre-split share count. For FY3/2027 it forecasts ¥12.00 at the interim and ¥16.00 at the year-end, ¥28.00 in all, on the post-split count — equivalent to ¥60.00, ¥80.00 and ¥140.00 before the split. The dividend forecast itself was not changed.
| Metric | Q1 FY3/2027 | Q1 FY3/2026 | Change |
|---|---|---|---|
| Revenue (¥ million) | 34,033 | 28,231 | +20.6% |
| Gross profit (¥ million) | 14,914 | 10,739 | +38.9% |
| Gross margin | 43.8% | 38.0% | +5.8 pt |
| SG&A expenses (¥ million) | 6,971 | 6,440 | +8.2% |
| Operating profit (¥ million) | 7,943 | 4,298 | +84.8% |
| Operating margin | 23.3% | 15.2% | +8.1 pt |
| Ordinary profit (¥ million) | 8,433 | 4,344 | +94.1% |
| Pre-tax profit (¥ million) | 8,358 | 4,315 | +93.7% |
| Net profit attrib. to owners of parent (¥ million) | 5,797 | 3,147 | +84.2% |
| EPS (¥) | 31.85 | 17.29 | +84.2% |
| Comprehensive income (¥ million) | 7,505 | 825 | +809.2% |
| Electronic Materials — revenue (¥ million) | 14,589 | 11,265 | +29.5% |
| Electronic Materials — segment profit (¥ million) | 7,036 | 4,139 | +70.0% |
| Medical — revenue (¥ million) | 3,818 | 3,573 | +6.8% |
| Medical — segment profit (¥ million) | 705 | 422 | +66.8% |
| Composites — revenue (¥ million) | 3,830 | 3,305 | +15.9% |
| Composites — segment profit (¥ million) | 0 | −15 | n.m. |
| Materials & Chemicals — revenue (¥ million) | 2,615 | 2,267 | +15.4% |
| Materials & Chemicals — segment profit (¥ million) | 222 | 109 | +103.3% |
| Insulation — revenue (¥ million) | 4,399 | 3,543 | +24.2% |
| Insulation — segment profit (¥ million) | 251 | −50 | loss to profit |
| Other — revenue (¥ million) | 4,780 | 4,276 | +11.8% |
| Other — segment profit (¥ million) | 213 | 112 | +90.8% |
| Segment profit adjustment (incl. unallocated corporate expense) (¥ million) | −486 | −417 | +16.5% |
| Cash and deposits (¥ million) | 45,476 | 62,014 | −26.7% |
| Total assets (¥ million) | 280,413 | 283,038 | −0.9% |
| Net assets (¥ million) | 183,935 | 180,383 | +2.0% |
| Equity ratio | 63.2% | 61.3% | +1.9 pt |
| FY3/2027 guidance — revenue (¥ million) | 141,000 | — | +19.3% |
| FY3/2027 guidance — operating profit (¥ million) | 30,000 | — | +44.1% |
| FY3/2027 guidance — ordinary profit (¥ million) | 30,000 | — | +39.2% |
| FY3/2027 guidance — net profit (¥ million) | 20,000 | — | −52.1% |
| FY3/2027 guidance — EPS (¥) | 109.87 | — | −52.1% |
| Annual dividend per share (¥) | 28.00 | — | — |
| Annual dividend per share, pre-split basis (¥) | 140.00 | 127.00 | +10.2% |
JapanStockPulse provides informational content only and does not constitute investment advice. Figures are taken from the company's published earnings short report and may be subject to subsequent revision.