A smaller cost base does the work
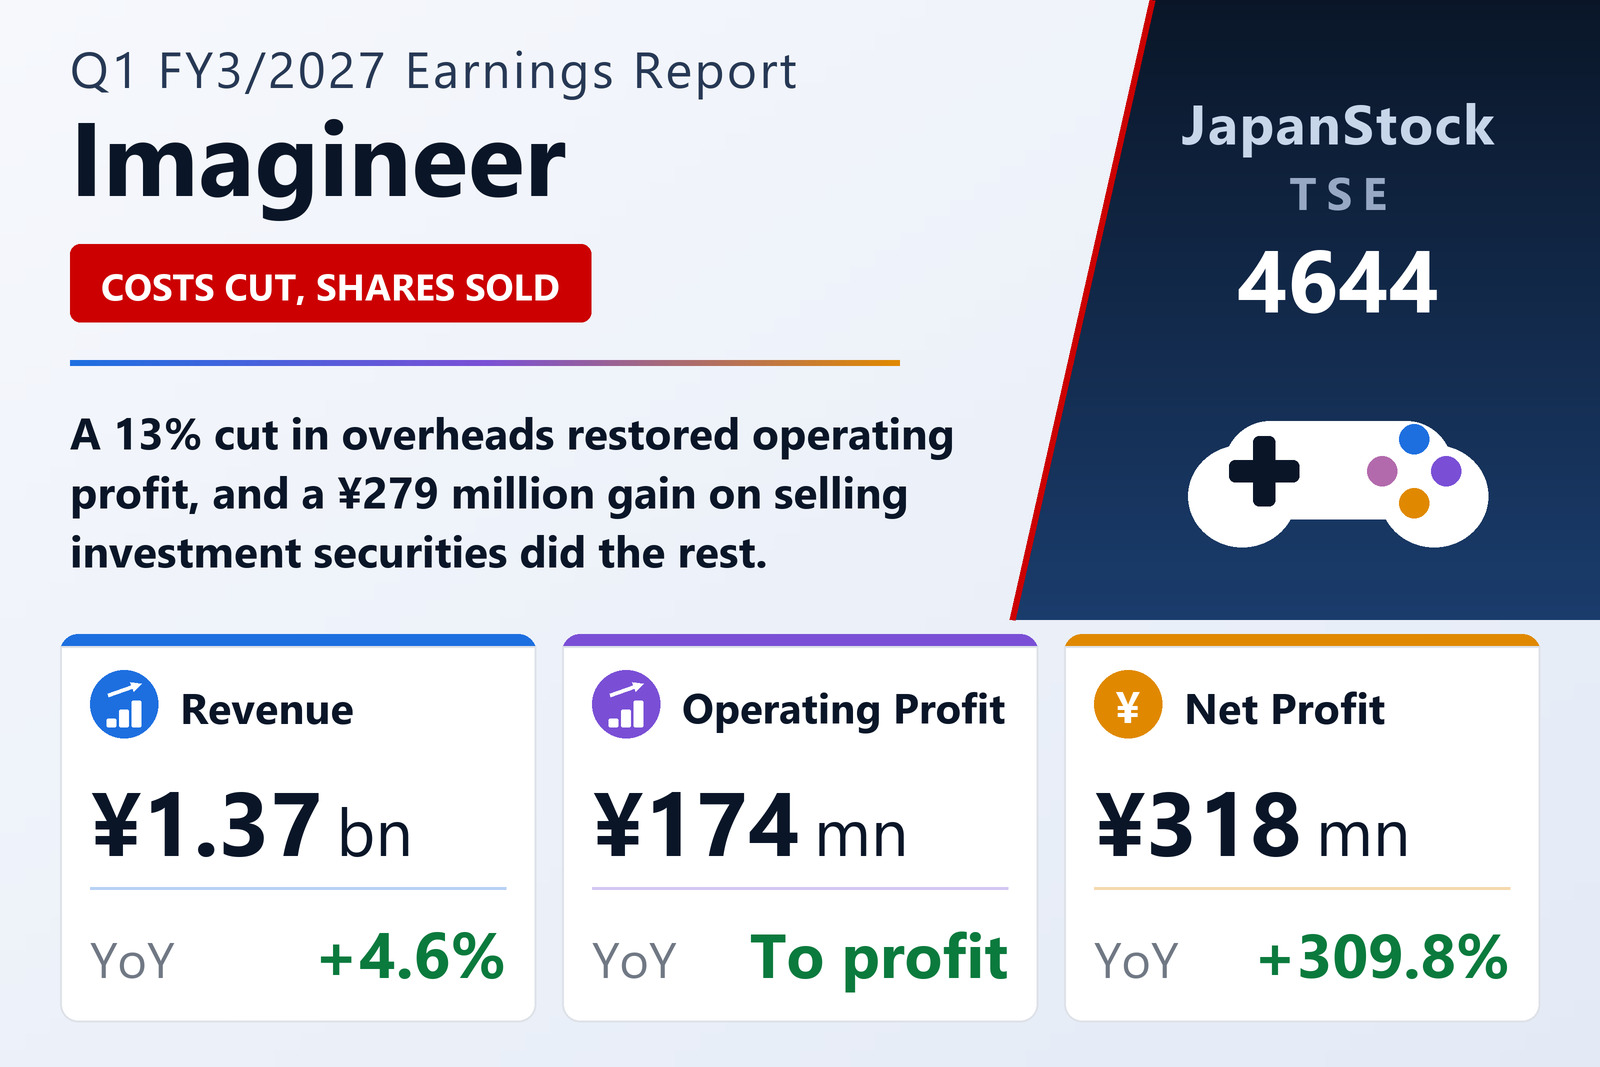
Imagineer Co., Ltd. (TSE: 4644) published consolidated results for the three months to June 30, 2026 on July 27, 2026 under Japanese GAAP. Revenue rose 4.6% to ¥1,365 million and gross profit 12.5% to ¥890 million, but the decisive move was on the expense line: selling, general and administrative expenses fell 13.4% to ¥716 million from ¥827 million. That swung operating profit to ¥174 million from a ¥36 million loss a year earlier.
Below the operating line the picture changes character. Non-operating income of ¥320 million included a ¥279 million gain on the sale of investment securities, against ¥200 million a year earlier, and non-operating expenses were negligible. Ordinary profit therefore reached ¥494 million, up 265.1%, and net profit attributable to shareholders ¥318 million, up 309.8%. Readers should weigh that: most of the bottom line is a disposal gain rather than operating performance.
One segment, one release
The group reports a single "Content" segment, so there is no segment breakdown to read. The quarter's product news was the release of Medarot Card Robottle RB for Nintendo Switch, part of the long-running Medabots franchise the company treats as a core intellectual property. Imagineer positions the content business as its medium- to long-term growth axis in an entertainment market it describes as still shifting.
A balance sheet that is mostly investments
Total assets rose ¥359 million to ¥13,352 million, but the composition changed sharply: deposits paid rose ¥6,954 million while investment securities fell ¥6,181 million — the other side of the disposals recorded above. Liabilities were almost flat at ¥912 million, up ¥17 million, as higher income taxes payable and other current liabilities offset a ¥40 million fall in operating payables. Net assets rose ¥342 million to ¥12,440 million, driven by a ¥347 million increase in the valuation difference on other securities; retained earnings edged down as the dividend exceeded the quarter's profit. Depreciation for the quarter was ¥3 million. With liabilities at less than 7% of the balance sheet, the company remains, in accounting terms, close to debt-free.
Guidance unchanged
Imagineer left the full-year FY3/2027 consolidated guidance published with its May 15, 2026 results announcement unchanged. This filing is the attachment section only and carries no cover page, so it discloses no earnings-per-share figure, no dividend table and no guidance numbers; the figures above are taken from the quarterly financial statements and the accompanying notes.
| Metric | Q1 FY3/2027 | Q1 FY3/2026 | Change |
|---|---|---|---|
| Net sales (¥ million) | 1,365 | 1,305 | +4.6% |
| Gross profit (¥ million) | 890 | 791 | +12.5% |
| SG&A expenses (¥ million) | 716 | 827 | -13.4% |
| Operating profit (¥ million) | 174 | -36 | loss to profit |
| Ordinary profit (¥ million) | 494 | 135 | +265.1% |
| Net profit attrib. to owners of parent (¥ million) | 318 | 78 | +309.8% |
| Total assets (¥ million) | 13,352 | 12,993 | +2.8% |
| Net assets (¥ million) | 12,440 | 12,098 | +2.8% |
JapanStockPulse provides informational content only and does not constitute investment advice. Figures are taken from the company's published earnings short report and may be subject to subsequent revision.