Revenue up a quarter, operating profit flat
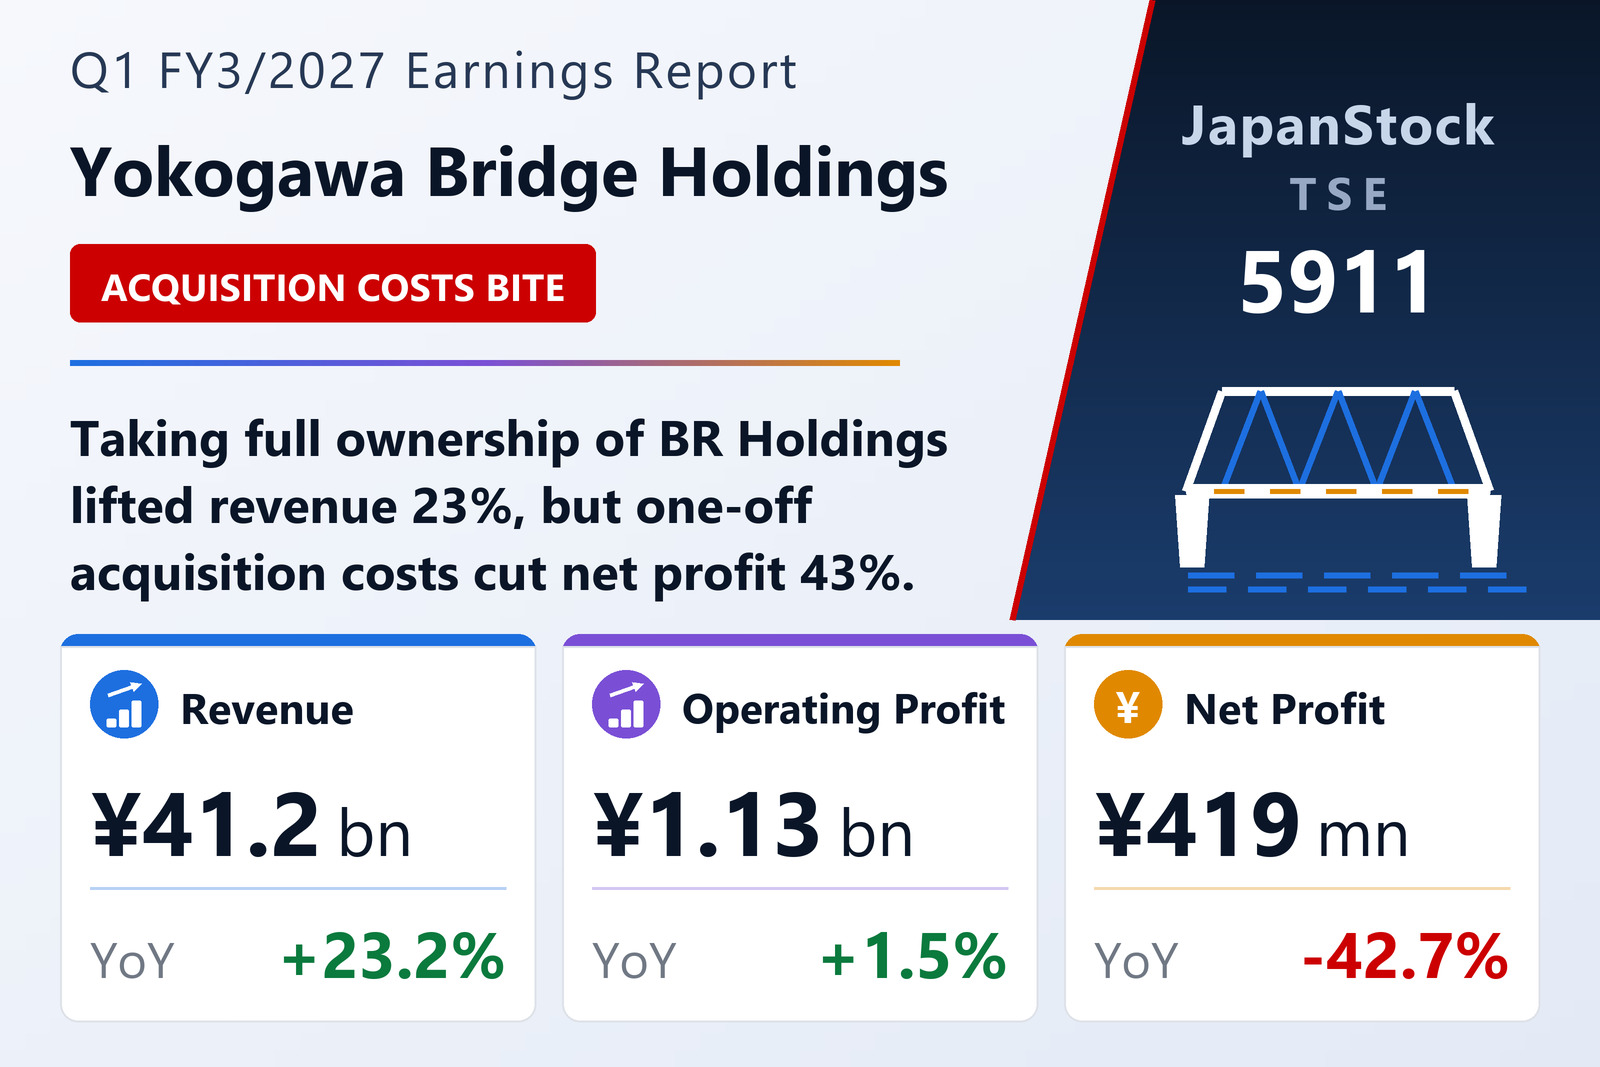
Yokogawa Bridge Holdings Corporation (TSE: 5911) published consolidated results for the three months to June 30, 2026 on July 27, 2026 under Japanese GAAP. Revenue rose 23.2% to ¥41,200 million, operating profit 1.5% to ¥1,134 million and ordinary profit 0.7% to ¥1,081 million, while net profit attributable to shareholders fell 42.7% to ¥419 million. Earnings per share were ¥10.66 against ¥18.30, and comprehensive income fell 56.6% to ¥829 million.
The comparison is not like for like. BR Holdings, consolidated in March 2026, was taken into full ownership during the quarter, and its results are included as though the acquisition had completed at the start of the year. That is what carries the top line up 23.2% while operating profit stands still — and the one-off costs of the transaction, booked below the ordinary line as an extraordinary loss, are what turn a flat operating result into a 42.7% fall in net profit.
Bridges grow but earn less
Bridges, the largest segment, lifted revenue 19.6% to ¥22,248 million on the BR Holdings contribution, but operating profit fell 49.0% to ¥367 million because of the mix of work in hand. Within the segment, new steel construction fell to ¥10.7 billion from ¥13.9 billion while newly added PC (prestressed concrete) work contributed ¥3.9 billion, maintenance rose to ¥6.4 billion from ¥4.6 billion, and overseas work added ¥1.1 billion.
System construction and engineering carry the profit
System Construction — pre-engineered steel buildings — grew revenue 11.4% to ¥11,026 million and operating profit 41.7% to ¥1,024 million, more than the group total, as a heavy opening order book converted smoothly into production. Engineering grew revenue 76.4% to ¥6,481 million and profit to ¥417 million from ¥23 million, helped by a full book in building and mechanical steelwork plus the new PC-products business. Advanced Technology, the smallest segment, grew revenue 15.2% to ¥1,322 million on precision-instrument work tied to semiconductor production equipment, but profit fell 25.8% to ¥116 million. Corporate costs not allocated to segments rose to ¥856 million from ¥578 million.
Orders fall 10% against a large overseas comparator
Group orders fell 10.4% to ¥34.29 billion, but the fall is concentrated in one place. Bridge orders halved to ¥11.33 billion (−50.9%) because the year-earlier quarter contained a large overseas contract that has no counterpart this year; domestic wins included the Ohnodai Kibou Bridge for East Nippon Expressway. Everything else grew: System Construction orders rose 31.4% to ¥13.49 billion on long-deferred large projects and a rebuilt face-to-face sales effort, with floor area ordered at 200,000 m² against 150,000 m²; Engineering rose 86.9% to ¥7.25 billion; and Advanced Technology rose 115.2% to ¥2.21 billion on pulled-forward semiconductor-equipment orders. Order backlog stood at ¥255.2 billion against ¥201.2 billion a year earlier.
Balance sheet, buyback and guidance
Total assets fell ¥3,860 million to ¥250,707 million, as a decline in trade receivables outweighed a small rise in investments on higher share prices. Liabilities rose ¥2,130 million to ¥118,640 million on advances received on uncompleted construction contracts and bonus provisions. Net assets fell ¥6,003 million to ¥132,065 million: the quarter's profit was more than offset by the elimination of non-controlling interests — the other side of the BR Holdings buyout — and by dividends. The equity ratio was 52.7% against 52.9%.
The board also resolved on a share buyback at its July 27, 2026 meeting; the earnings-per-share figure in the full-year guidance already reflects it. Guidance itself, published on May 13, 2026, is unchanged: full-year revenue of ¥198,000 million (+37.6%), operating profit of ¥12,000 million (−11.1%), ordinary profit of ¥11,200 million (−17.7%) and net profit of ¥8,200 million (−5.6%), for earnings per share of ¥209.62. The first quarter therefore represents 20.8% of the revenue target but only 9.5% of the operating-profit target — a back-loaded shape typical of construction. The annual dividend forecast rises to ¥130.00 from ¥120.00.
| Metric | Q1 FY3/2027 | Q1 FY3/2026 | Change |
|---|---|---|---|
| Net sales (¥ million) | 41,200 | 33,451 | +23.2% |
| Operating profit (¥ million) | 1,134 | 1,117 | +1.5% |
| Ordinary profit (¥ million) | 1,081 | 1,074 | +0.7% |
| Net profit attrib. to owners of parent (¥ million) | 419 | 732 | -42.7% |
| Comprehensive income (¥ million) | 829 | 1,910 | -56.6% |
| EPS (¥) | 10.66 | 18.30 | -41.7% |
| Bridges — revenue (¥ million) | 22,248 | 18,596 | +19.6% |
| Bridges — segment profit (¥ million) | 367 | 719 | -49.0% |
| System Construction — revenue (¥ million) | 11,026 | 9,897 | +11.4% |
| System Construction — segment profit (¥ million) | 1,024 | 722 | +41.7% |
| Engineering — revenue (¥ million) | 6,481 | 3,674 | +76.4% |
| Engineering — segment profit (¥ million) | 417 | 23 | n.m. |
| Advanced Technology — revenue (¥ million) | 1,322 | 1,147 | +15.2% |
| Advanced Technology — segment profit (¥ million) | 116 | 156 | -25.8% |
| Total assets (¥ million) | 250,707 | 254,572 | -1.5% |
| Net assets (¥ million) | 132,065 | 138,068 | -4.3% |
| Equity ratio | 52.7% | 52.9% | -0.2 pt |
| FY3/2027 guidance — revenue (¥ million) | 198,000 | — | +37.6% |
| FY3/2027 guidance — operating profit (¥ million) | 12,000 | — | -11.1% |
| FY3/2027 guidance — ordinary profit (¥ million) | 11,200 | — | -17.7% |
| FY3/2027 guidance — net profit (¥ million) | 8,200 | — | -5.6% |
| FY3/2027 guidance — EPS (¥) | 209.62 | — | — |
| Annual dividend per share (¥) | 130.00 | 120.00 | +8.3% |
JapanStockPulse provides informational content only and does not constitute investment advice. Figures are taken from the company's published earnings short report and may be subject to subsequent revision.