Every product line the company names sold better
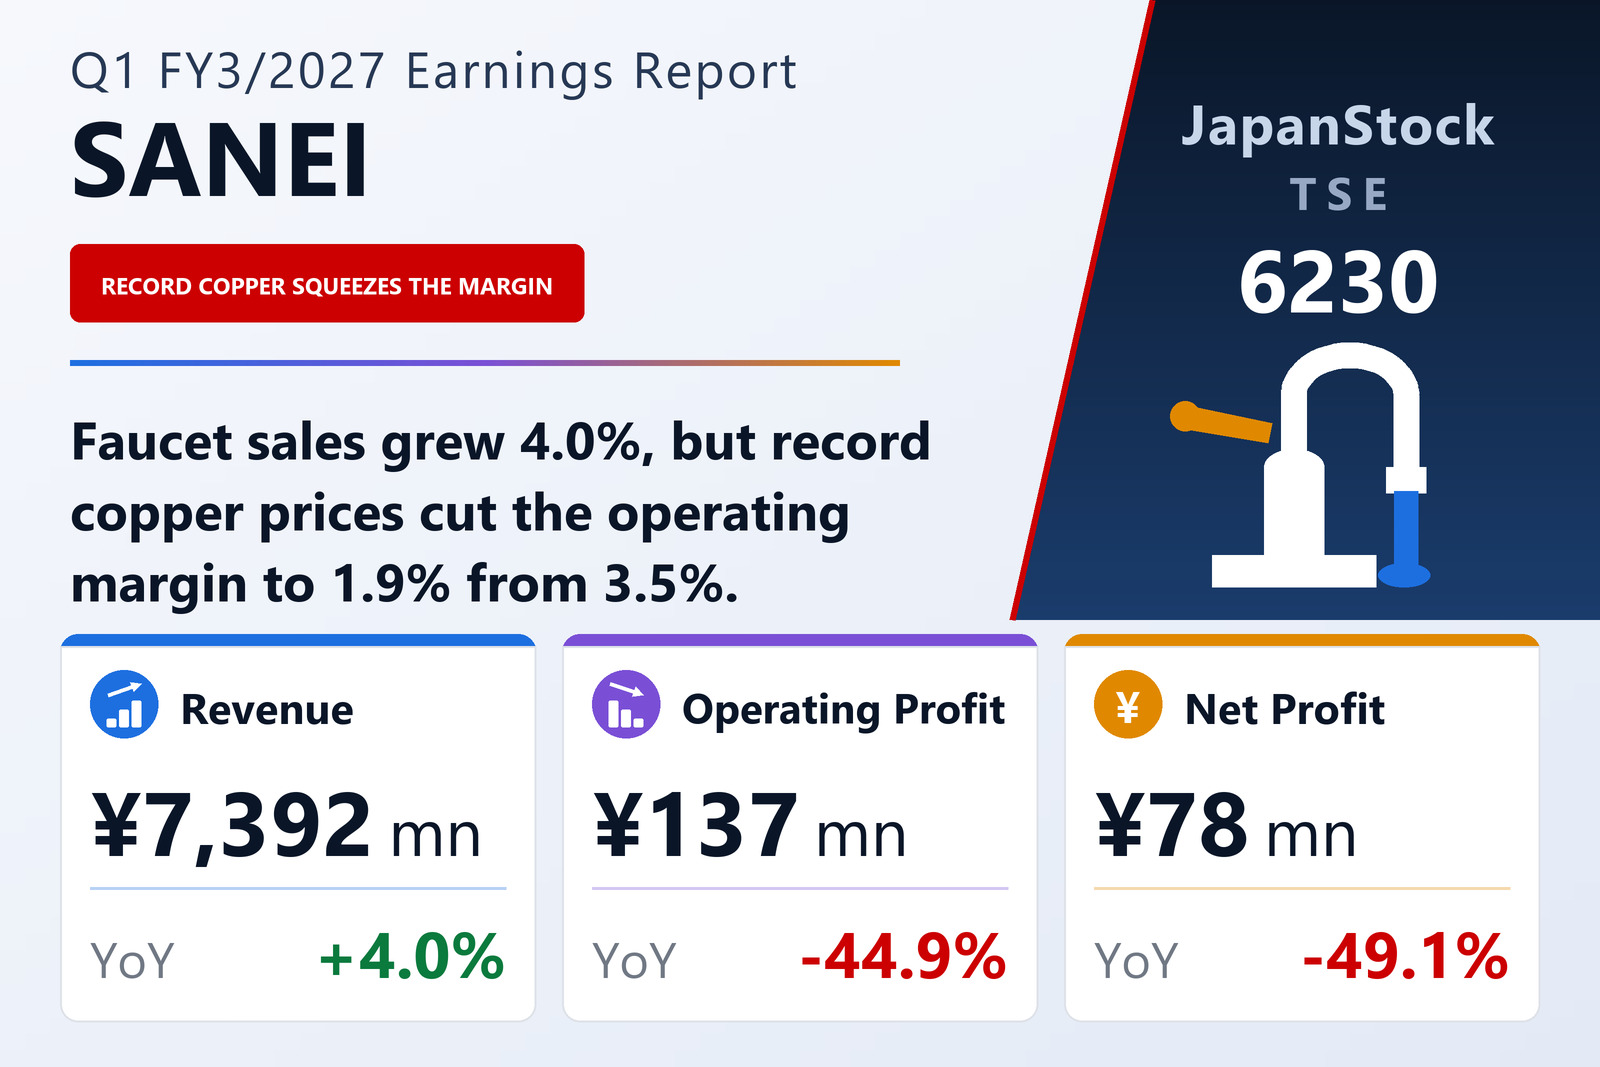
SANEI LTD. (TSE: 6230) published consolidated results for the three months to June 30, 2026 on July 27, 2026 under Japanese GAAP. Net sales rose 4.0% to ¥7,392 million, but operating profit fell 44.9% to ¥137 million, ordinary profit 52.7% to ¥127 million and net profit 49.1% to ¥78 million, for earnings per share of ¥17.10 against ¥33.61. The company runs a single segment: faucet fittings.
The top line is not the problem, and the company's account of it is specific. Its IENI range — built on the concept of "comfort and simplicity, at home" — continued to perform, and its design-led sʌnei range won wider adoption in non-residential settings such as hotels and restaurants. Sales of higher-value products grew too, including ultra-fine-bubble products and the pre-rinse faucet that has held up since launch. It attributes the rest to selling across many brands and many distribution routes.
Demand was helped by housing starts, which ran well above the prior year in April and May on a rebound from a weak base plus higher starts of owner-occupied and built-for-sale homes. The company is explicit that the outlook is unstable from here, given raw-material costs.
Copper is the whole of the profit story
On the profit line the company gives one reason: the market price of copper, its main raw material, set successive record highs from the start of the calendar year, and the resulting cost increase hit hard. It is proceeding with price revisions, but says that in this quarter the revisions took time to feed through and did not fully absorb the raw-material increase. From the second quarter it expects the revisions to permeate and profitability to improve.
The scale of the squeeze is visible in the margin: 1.9% against 3.5% on 4.0% higher sales. Comprehensive income was ¥137 million against ¥143 million, down only 4.7% — a much smaller fall than the net line, which is what happens when the operating shortfall is partly offset in other comprehensive income.
A guidance shape that assumes the fix works
The balance sheet barely moved. Total assets rose 1.3% from the March year-end to ¥24,418 million, net assets slipped 0.2% to ¥15,692 million and the equity ratio eased to 62.1% from 63.0%.
Guidance published on May 7, 2026 is unchanged: for the first half, net sales of ¥15,000 million (+6.9%), operating profit of ¥780 million (+16.9%), ordinary profit of ¥750 million (+7.8%) and net profit of ¥480 million (+8.9%); for the full year, net sales of ¥30,800 million (+6.1%), operating profit of ¥2,000 million (+9.2%), ordinary profit of ¥1,950 million (+8.1%) and net profit of ¥1,280 million (+4.8%), for earnings per share of ¥279.61. The arithmetic is demanding: the quarter delivered only 6.9% of the full-year operating-profit target on 24.0% of the sales target, so the remaining nine months have to earn ¥1,863 million against ¥137 million just banked. That target rests entirely on the price revisions permeating as described. The annual dividend rises to ¥75.00 from ¥69.00, split ¥37.00 interim and ¥38.00 final; note that the prior year's ¥37.00 year-end payment included a ¥5.00 commemorative dividend on top of ¥32.00 ordinary.
| Metric | Q1 FY3/2027 | Q1 FY3/2026 | Change |
|---|---|---|---|
| Net sales (¥ million) | 7,392 | 7,109 | +4.0% |
| Operating profit (¥ million) | 137 | 249 | −44.9% |
| Operating margin | 1.9% | 3.5% | −1.6 pt |
| Ordinary profit (¥ million) | 127 | 268 | −52.7% |
| Net profit (¥ million) | 78 | 153 | −49.1% |
| EPS (¥) | 17.10 | 33.61 | −49.1% |
| Total assets (¥ million) | 24,418 | 24,111 | +1.3% |
| Net assets (¥ million) | 15,692 | 15,724 | −0.2% |
| Equity ratio | 62.1% | 63.0% | −0.9 pt |
| FY3/2027 guidance — revenue (¥ million) | 30,800 | — | +6.1% |
| FY3/2027 guidance — operating profit (¥ million) | 2,000 | — | +9.2% |
| FY3/2027 guidance — ordinary profit (¥ million) | 1,950 | — | +8.1% |
| FY3/2027 guidance — net profit (¥ million) | 1,280 | — | +4.8% |
| FY3/2027 guidance — EPS (¥) | 279.61 | — | n.m. |
| Annual dividend per share (¥) | 75.00 | 69.00 | +8.7% |
JapanStockPulse provides informational content only and does not constitute investment advice. Figures are taken from the company's published earnings short report and may be subject to subsequent revision.