Sales up, gross profit down — the whole quarter in one line
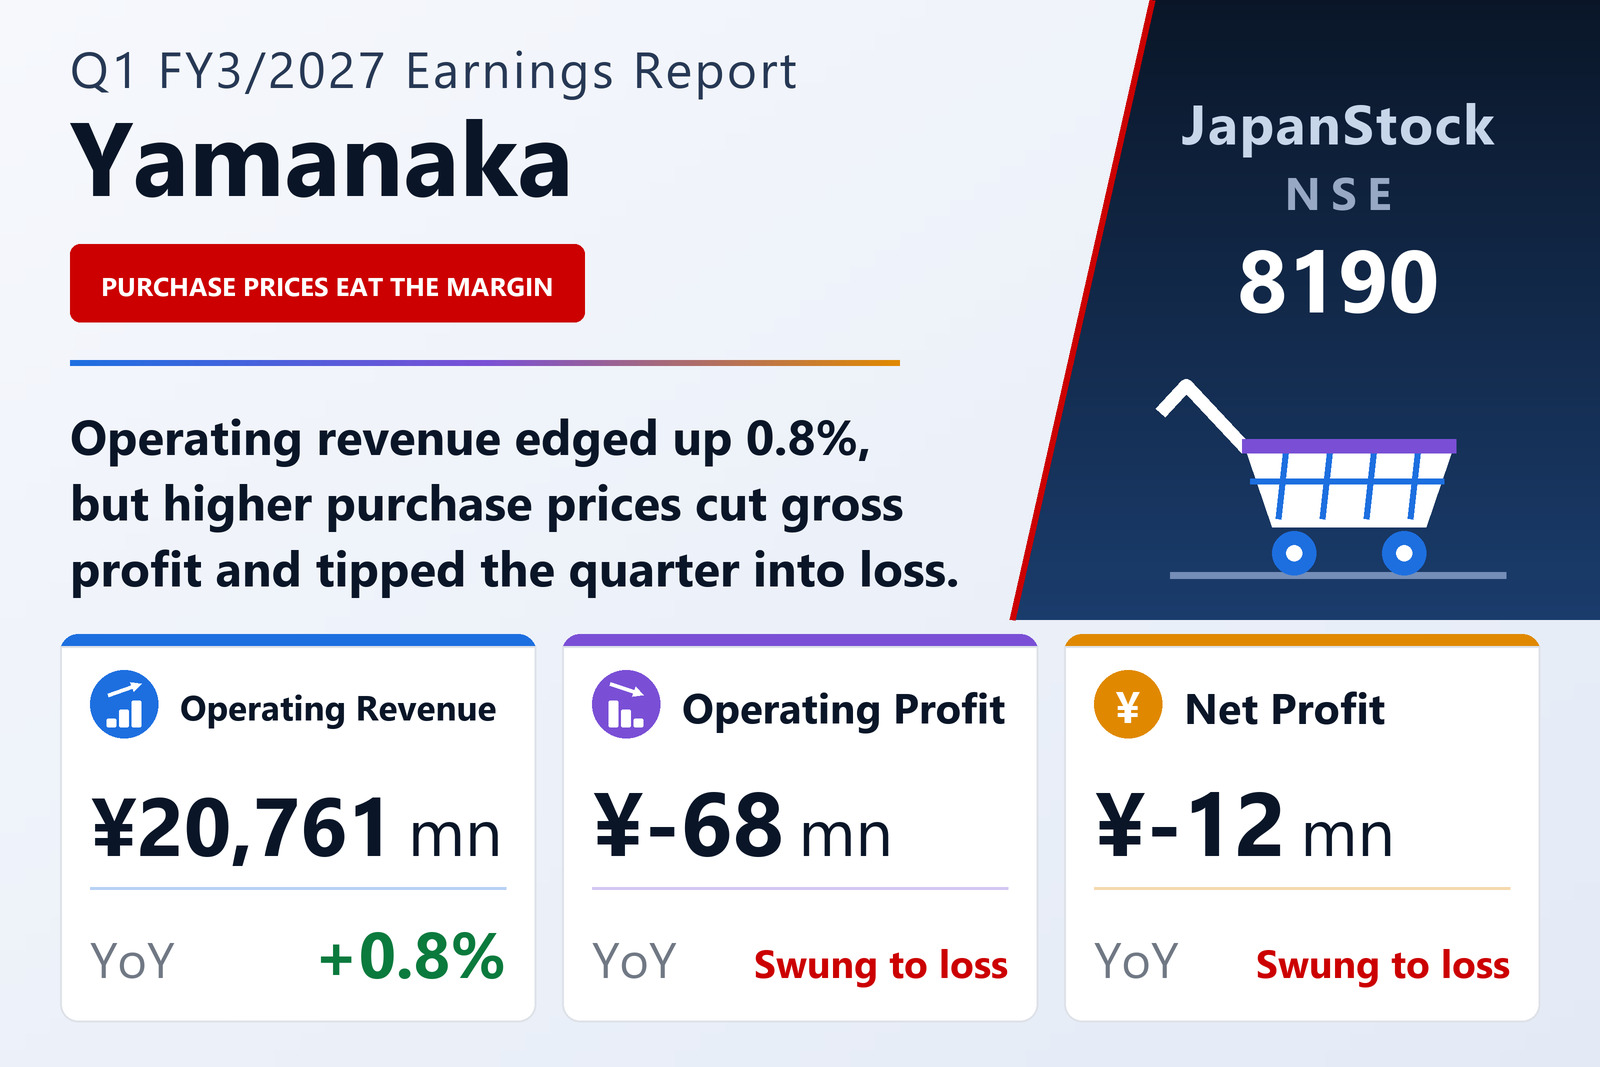
Yamanaka Co., Ltd. (NSE: 8190) published consolidated results for the three months to June 20, 2026 on July 27, 2026 under Japanese GAAP. Operating revenue — the company's reported top line, being net sales plus operating income — rose 0.8% to ¥20,761 million. Below that it swung to an operating loss of ¥68 million from a ¥50 million profit, an ordinary loss of ¥54 million from a ¥74 million profit and a net loss of ¥12 million from a ¥25 million profit, for a loss per share of ¥0.68 against earnings of ¥1.35. Yamanaka runs a single segment: retail and retail-adjacent businesses.
The company's own summary is one sentence long and does all the work: revenue increased, but gross profit decreased because of higher purchase prices for goods. Nothing in the operating-cost line is blamed. In a food-retail business running on a low-single-digit operating margin at the best of times, a gross-margin move of that size is enough to take the whole quarter below zero.
The competitive backdrop it describes is tough on the same axis. Continuous price inflation has sharpened consumers' defensive instincts and their saving mindset, and competition has intensified across format boundaries — general merchandise stores, drugstores and discounters are all fishing in the same water.
The response is fresh food, renovations and everyday pricing
This is the final year of Yamanaka's current three-year plan, run under the slogan "Fresh Drives Growth" — a sales-growth strategy with the fresh-food departments at its core. It plans 14 store renovations this financial year and completed five in the quarter: Tokai, Chita and Takayokosuka in May, then Arte Shinmaiko and Shin-Anjo in June, all in Aichi Prefecture. Alongside the renovations it is pushing Every Day Reasonable Price, aimed at making the stores somewhere customers can shop daily without worrying about price.
On merchandise it leaned on own-production items: a national-chicken katsu curry made with fresh breadcrumbs from its processing centre, an original saikyo-marinated Spanish mackerel in the seafood department, a large-format value produce range, and increased-volume promotions in fresh foods after the spring and Golden Week holidays — 30% more sushi, 50% more yakisoba noodles from its own factory. It also reorganised the delicatessen business, which it calls the core of its fresh-food strategy, and continued store-traffic work through mystery-solving events built around its own character.
A near-static balance sheet and a guidance step-up the quarter does not yet show
The balance sheet is almost unchanged: total assets up 0.1% from the March year-end to ¥42,463 million, net assets down 0.2% to ¥18,028 million and the equity ratio at 42.5% against 42.6%. Comprehensive income was ¥61 million against a ¥36 million loss.
Guidance published on April 27, 2026 is unchanged: operating revenue of ¥90,500 million (+8.7%), operating profit of ¥480 million against a prior-year operating loss, ordinary profit of ¥520 million (+254.2%) and net profit of ¥350 million (+241.9%), for earnings per share of ¥18.38. That revenue target is worth flagging: the quarter grew 0.8% while the year is guided to grow 8.7%, and the filing offers no explanation of the gap beyond confirming the forecast is unrevised. The annual dividend is held at ¥10.00, split ¥5.00 interim and ¥5.00 final.
| Metric | Q1 FY3/2027 | Q1 FY3/2026 | Change |
|---|---|---|---|
| Operating revenue (¥ million) | 20,761 | 20,590 | +0.8% |
| Operating profit (¥ million) | −68 | 50 | profit to loss |
| Ordinary profit (¥ million) | −54 | 74 | profit to loss |
| Net profit (¥ million) | −12 | 25 | profit to loss |
| EPS (¥) | −0.68 | 1.35 | profit to loss |
| Total assets (¥ million) | 42,463 | 42,401 | +0.1% |
| Net assets (¥ million) | 18,028 | 18,061 | −0.2% |
| Equity ratio | 42.5% | 42.6% | −0.1 pt |
| FY3/2027 guidance — operating revenue (¥ million) | 90,500 | — | +8.7% |
| FY3/2027 guidance — operating profit (¥ million) | 480 | — | loss to profit |
| FY3/2027 guidance — ordinary profit (¥ million) | 520 | — | +254.2% |
| FY3/2027 guidance — net profit (¥ million) | 350 | — | +241.9% |
| FY3/2027 guidance — EPS (¥) | 18.38 | — | n.m. |
| Annual dividend per share (¥) | 10.00 | 10.00 | unchanged |
JapanStockPulse provides informational content only and does not constitute investment advice. Figures are taken from the company's published earnings short report and may be subject to subsequent revision.