Operating leverage in its purest form
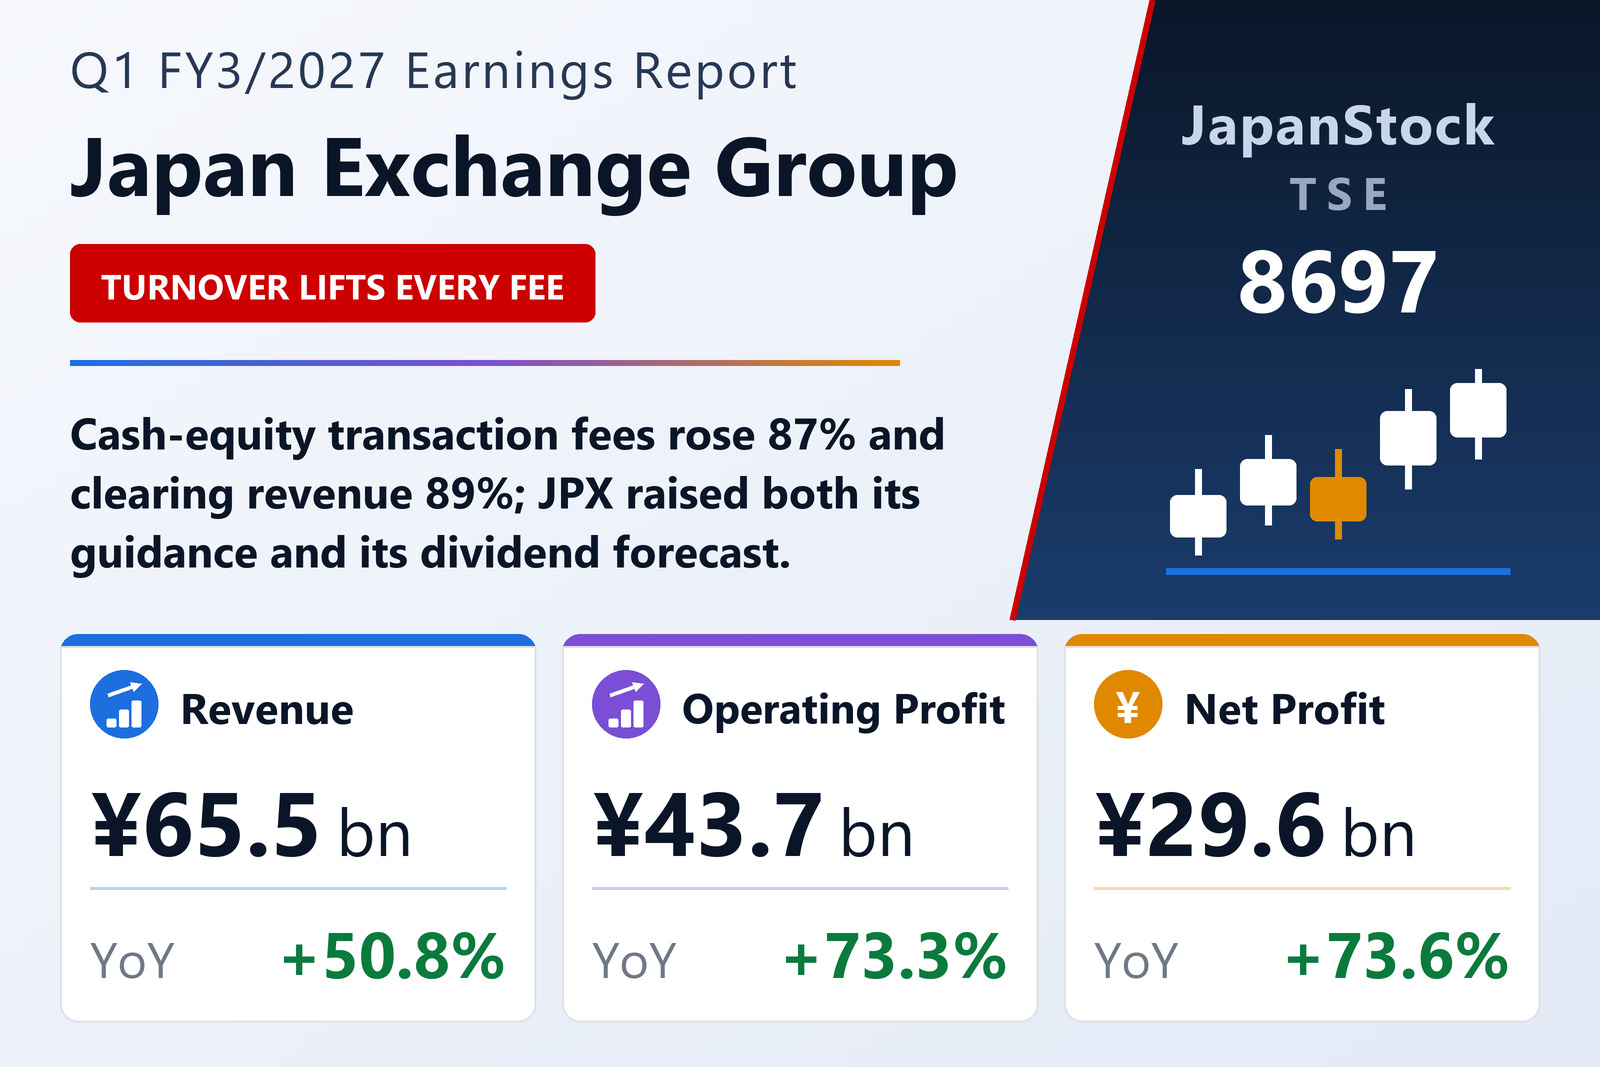
Japan Exchange Group, Inc. (TSE: 8697) published consolidated results for the three months to June 30, 2026 on July 28, 2026 under IFRS. Operating revenue rose 50.8% to ¥65,515 million while operating expenses rose only 22.4% to ¥23,146 million, so operating profit rose 73.3% to ¥43,716 million. Pre-tax profit rose 74.1% to ¥44,062 million and profit attributable to owners 73.6% to ¥29,567 million. Basic earnings per share were ¥28.81 against ¥16.42, and comprehensive income rose 72.2% to ¥30,189 million. The operating margin reached 66.7%.
This is what an exchange looks like in a heavy-turnover quarter: revenue is largely variable with trading activity while the cost base — people, systems, depreciation — is largely fixed. Of the ¥22,064 million of extra revenue, ¥17,821 million dropped through to operating profit.
Cash equities drive trading and clearing alike
Trading services revenue rose 60.4% to ¥27,837 million. Within it, transaction fees rose 69.9% to ¥24,647 million, and cash-equity transaction fees alone rose 86.7% to ¥21,928 million — turnover value on the Prime, Standard, Growth and TOKYO PRO markets was well above a year earlier. Financial derivatives added a more modest 4.9% to ¥2,553 million, with JGB futures up 20.8%, Nikkei 225 options up 6.6% and TOPIX futures up 2.1% while Nikkei 225 futures fell 7.5%; commodity derivatives fell 49.1%. Access fees rose 19.2% to ¥1,881 million on higher order counts.
Clearing services, run through Japan Securities Clearing Corporation, was the fastest-growing line, rising 88.9% to ¥20,150 million — the same cash-equity volumes reaching the group a second time. Listing services rose 20.2% to ¥4,519 million, with initial and secondary listing fees more than doubling to ¥842 million and annual listing fees up 9.9% to ¥3,676 million on higher market capitalisation. Information services rose 15.4% to ¥9,311 million on market-data fees and the index business, and system services 2.2% to ¥3,480 million.
Costs up, but mostly in one line
Operating expenses rose 22.4% to ¥23,146 million. Personnel costs rose 13.4% to ¥6,157 million, system maintenance and operation 10.5% to ¥5,657 million and depreciation and amortisation just 0.6% to ¥4,518 million. The outlier is other operating expenses, up 76.4% to ¥6,812 million — the single largest contributor to the cost increase, and the line to watch if turnover normalises.
Why the equity ratio reads 0.5%
Total assets fell 5.7% to ¥67,538,582 million and equity attributable to owners 6.9% to ¥321,138 million, leaving an owners' equity ratio of 0.5%. That figure should not be read as leverage. JPX grosses up on both sides of its balance sheet the clearing assets and liabilities that Japan Securities Clearing Corporation assumes as a central counterparty, plus clearing participants' deposits and the statutory funds that back market safety. Those items are enormous, swing daily with participants' positions, and net to nothing economically; the ¥4,060,984 million fall in total assets this quarter is mostly a fall in clearing assets. The company directs readers to its own balance-sheet discussion for a view excluding those items.
Guidance and dividend both raised
JPX revised the guidance published with its FY3/2026 results on April 28, 2026. Full-year operating revenue is now ¥241,500 million (+21.5%), operating profit ¥145,500 million (+25.1%), pre-tax profit ¥147,000 million (+25.7%), profit ¥100,500 million (+23.4%) and profit attributable to owners ¥98,500 million (+24.5%), for basic earnings per share of ¥96.40. The forecast assumes full-year average daily turnover of ¥10.2 trillion in equities, 51,000 units in JGB futures, 87,000 in TOPIX futures, 136,000 in Nikkei 225 futures and ¥30.0 billion in Nikkei 225 options. The first quarter has already delivered 27.1% of the revenue target and 30.0% of the operating-profit target.
The dividend forecast was raised to an ordinary dividend of ¥77.00 for FY3/2027, against ¥61.00 paid for FY3/2026. JPX targets a payout ratio of 60% or more, balanced against the financial soundness expected of an exchange group, the risk buffer required of a clearing house and investment in its markets' competitiveness.
| Metric | Q1 FY3/2027 | Q1 FY3/2026 | Change |
|---|---|---|---|
| Operating revenue (¥ million) | 65,515 | 43,451 | +50.8% |
| Operating profit (¥ million) | 43,716 | 25,233 | +73.3% |
| Pre-tax profit (¥ million) | 44,062 | 25,310 | +74.1% |
| Net profit attrib. to owners of parent (¥ million) | 29,567 | 17,029 | +73.6% |
| Comprehensive income (¥ million) | 30,189 | 17,530 | +72.2% |
| EPS (¥) | 28.81 | 16.42 | +75.5% |
| Trading services — revenue (¥ million) | 27,837 | 17,356 | +60.4% |
| Clearing services — revenue (¥ million) | 20,150 | 10,665 | +88.9% |
| Listing services — revenue (¥ million) | 4,519 | 3,760 | +20.2% |
| Information services — revenue (¥ million) | 9,311 | 8,069 | +15.4% |
| System services — revenue (¥ million) | 3,480 | 3,404 | +2.2% |
| Total assets (¥ million) | 67,538,582 | 71,599,566 | -5.7% |
| Equity attrib. to owners of parent (¥ million) | 321,138 | 345,015 | -6.9% |
| Equity ratio | 0.5% | 0.5% | unchanged |
| FY3/2027 guidance — operating revenue (¥ million) | 241,500 | — | +21.5% |
| FY3/2027 guidance — operating profit (¥ million) | 145,500 | — | +25.1% |
| FY3/2027 guidance — pre-tax profit (¥ million) | 147,000 | — | +25.7% |
| FY3/2027 guidance — net profit (¥ million) | 98,500 | — | +24.5% |
| FY3/2027 guidance — EPS (¥) | 96.40 | — | — |
| Annual dividend per share (¥) | 77.00 | 61.00 | +26.2% |
JapanStockPulse provides informational content only and does not constitute investment advice. Figures are taken from the company's published earnings short report and may be subject to subsequent revision.