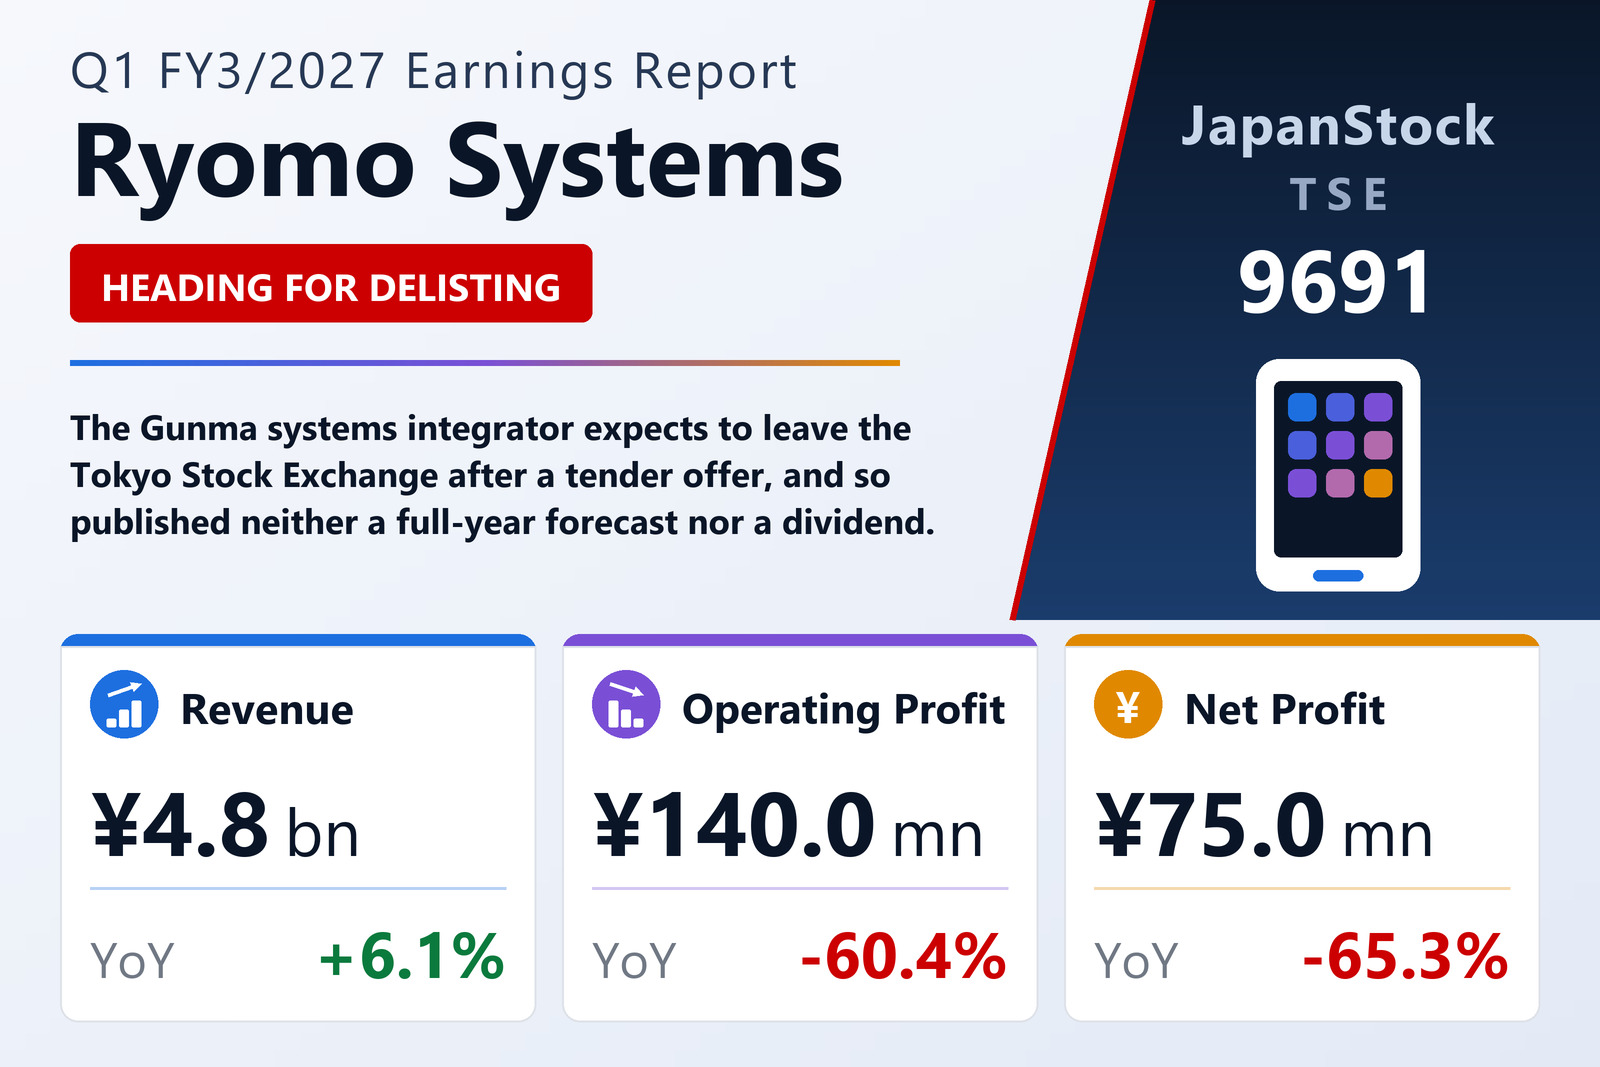
Ryomo Systems Co., Ltd. (TSE: 9691), a regional systems integrator that builds software for water utilities, local governments, schools and energy companies, reported first-quarter consolidated results for the three months to June 30, 2026 under Japanese GAAP — and framed them around an unusual disclosure. The company said it expects to be delisted once the prescribed procedures are completed, and therefore is not publishing a consolidated forecast for the fiscal year ending March 2027. Revenue for the quarter rose 6.1% to ¥4,801 million, while operating profit fell 60.4% to ¥140 million, ordinary profit fell 54.0% to ¥162 million and net profit attributable to owners of the parent dropped 65.3% to ¥75 million.
A tender offer that ends the listing
The company pointed to two of its own announcements. On May 14, 2026 it expressed support for, and recommended that shareholders tender into, the tender offer for its shares launched by its controlling shareholder Mitsuba Corporation together with Chubu Electric Power Co., Inc., and disclosed a capital and business alliance agreement concluded with Chubu Electric Power. On July 9, 2026 it announced the results of that tender offer and the resulting change in its major shareholders. Because the shares are expected to be delisted after the prescribed procedures, the company omitted FY3/2027 guidance entirely. The tender offer, which ran from May 15, closed on July 8, 2026, and is also carried in the quarterly report as a material subsequent event.
No dividend for FY3/2027
The same corporate change removes the payout. In a May 14, 2026 notice on dividends of surplus, Ryomo Systems resolved to pay neither an interim nor a year-end dividend for FY3/2027. That contrasts with the prior year, when the company paid ¥22.00 at the interim and ¥22.00 at year-end for an annual total of ¥44.00 per share. Basic earnings per share for the quarter were ¥21.66, against ¥62.34 a year earlier.
Both segments grew revenue but earned less
The public-sector business lifted revenue 5.0% to ¥2,344 million while segment profit fell 15.0% to ¥355 million. Sales of the "WINS" system to water utilities, and of IT hardware and related services to schools, held up well, but software development and system sales declined against a tough comparison with the previous year's local-government system-standardisation work. The social and industrial business raised revenue 7.1% to ¥2,457 million with segment profit down 8.6% to ¥373 million: the mobility business shrank as the operating environment around the auto industry shifted, offset by large systems-integration projects for energy utilities and steady sales of the "GIOS" system. Comprehensive income for the quarter was ¥143 million, down 33.0%.
Balance sheet firms up, cash builds
Total assets fell to ¥26,763 million from ¥27,896 million at the March year-end, mainly on a decline in notes and accounts receivable. Net assets edged up to ¥16,427 million from ¥16,361 million, lifting the equity ratio to 61.4% from 58.7%. Operating cash flow was ¥1,736 million (¥1,998 million a year earlier), investing activities used ¥126 million and financing activities used ¥358 million, leaving period-end cash and cash equivalents at ¥7,889 million, up ¥1,256 million from the year-end.
Fourth year of the 10th medium-term plan
Operationally, the group is in the fourth year of its 10th Medium-Term Management Plan (FY2023–FY2027), run under the policy of "raising the group's combined strength, tackling social issues and growing together with customers", with "speed", "transformation" and "new value creation" as keywords and three priority themes — strengthen and expand, transform and grow, and structural reform. Management described a Japanese economy in moderate recovery, with corporate earnings improving, but flagged rising raw-material and energy prices and wariness over an unstable international situation as reasons the outlook remains uncertain.
| Metric | Q1 FY3/2027 | Q1 FY3/2026 | YoY |
|---|---|---|---|
| Revenue (¥ million) | 4,801 | 4,526 | +6.1% |
| Operating profit (¥ million) | 140 | 354 | -60.4% |
| Ordinary profit (¥ million) | 162 | 352 | -54.0% |
| Net profit attrib. to owners (¥ million) | 75 | 218 | -65.3% |
| Comprehensive income (¥ million) | 143 | 213 | -33.0% |
| Basic EPS (¥) | 21.66 | 62.34 | -65.3% |
| Public-sector revenue (¥ million) | 2,344 | 2,232 | +5.0% |
| Public-sector segment profit (¥ million) | 355 | 418 | -15.0% |
| Social & industrial revenue (¥ million) | 2,457 | 2,294 | +7.1% |
| Social & industrial segment profit (¥ million) | 373 | 408 | -8.6% |
| Annual dividend (¥) | None | 44.00 | n/a |
JapanStockPulse provides informational content only and does not constitute investment advice. Figures are taken from the company's published earnings short report and may be subject to subsequent revision.